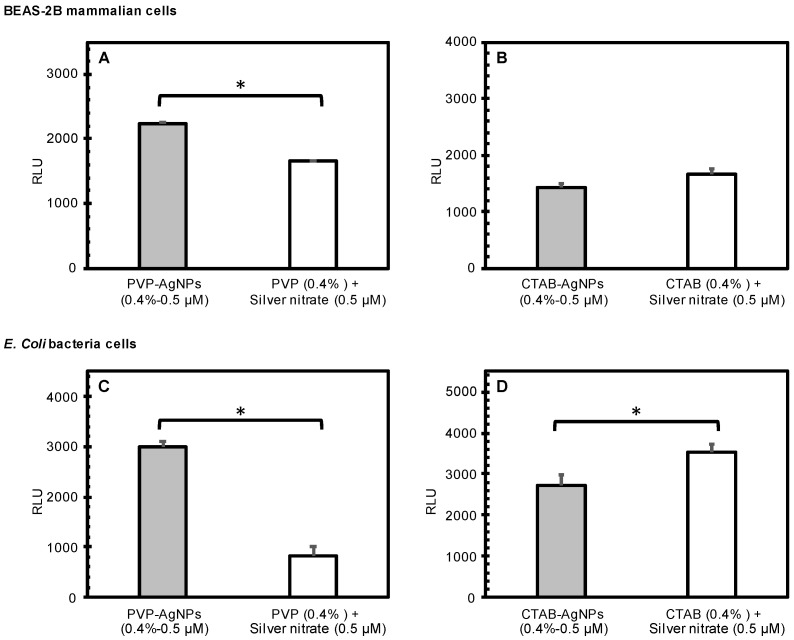
Figure 5.
Comparison of the effects of surface-stabilized silver nanoparticles (measured) to the predicted cumulative effects of stabilizing agents and silver nitrate as calculated from independent component treatments. The graphs show the average RLU generated by treatment of BEAS-2B mammalian cells (A,B) and E. coli bacterial cells (C,D) with PVP-AgNPs (0.5 µM; (A,C)) and CTAB-AgNPs (0.5 µM; (B,D)). Error bars depict one standard deviation from the mean. Significantly different means are indicated by an asterisk (p < 0.05).

