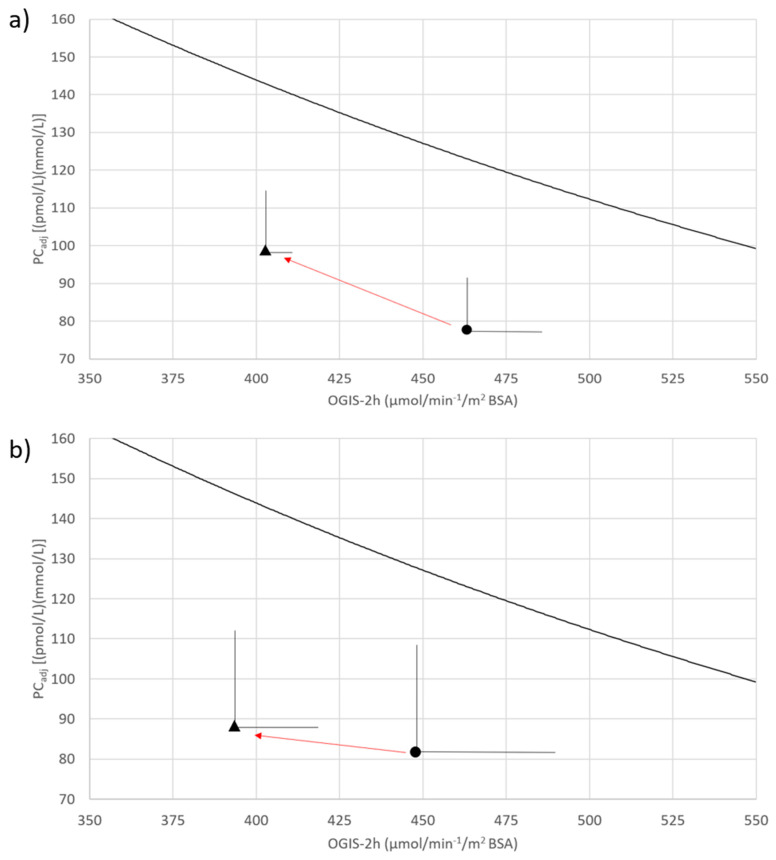
Figure 2.
Joint changes in insulin sensitivity (OGIS-2h; x-axis) and in glucose stimulated insulin bioavailability (PCadj; y-axis) before and after CFTR modulators therapy. Points represent the joint action of glucose-stimulated insulin bioavailability (PCadj) and insulin sensitivity (OGIS) before (circle) and after (triangle) CFTR modulator’s therapy, while trajectory is the change over time. Lumacaftor/Ivacaftor therapy (a) and Elexacaftor-Ivacaftor-Tezacaftor therapy (b) effects are respectively represented. The concave line in the vector plots is the physiological inverse (hyperbolic) relationship of the glucose-stimulated insulin bioavailability vs. insulin sensitivity found in 11 individuals, delta508F homozygotic, with normal glucose homeostasis (NGT). The area below the concave line houses the less than normal adaptation to insulin sensitivity. The greater the distance between a point in this area and the concave line, the worse the body’s adaptation, and the worse the glucose regulation. Differences between PCadj values were detected by Students’ t-test and by Wilcoxon signed rank test between OGIS-2h values. No significant differences were found except for OGIS-2h before and after Lumacaftor/Ivacaftor therapy (panel a, p-value = 0.004).

