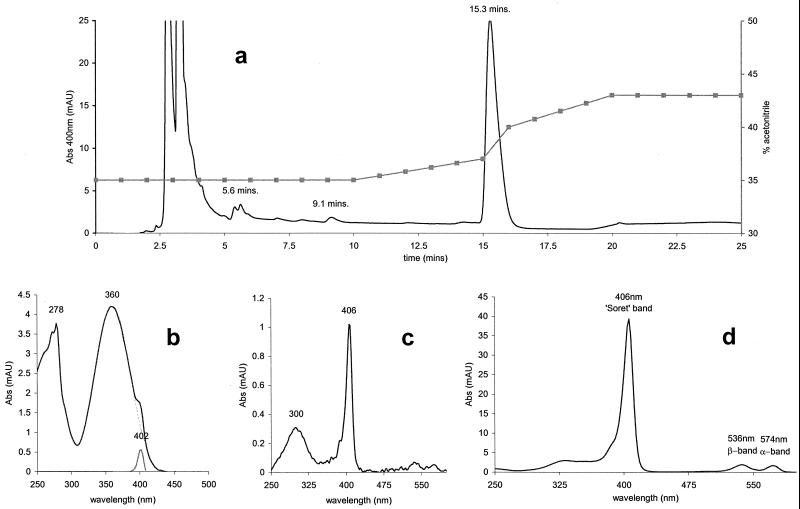
FIG. 3.
HPLC elution profile and absorbance (Abs) spectra of T. fusca porphyrin. (a) Elution profile from HPLC fractionation. Solid line, absorbance at 400 nm (milliabsorbance units [mAU]); squares, acetonitrile gradient. (b) Absorption spectrum of 400-nm elution peak at 5.6 min, shown with subtraction of simulated 360-nm absorbing species. Black line, actual spectrum; broken line, simulation of 360-nm species; grey line, spectrum minus simulation, i.e., showing the porphyrin Soret peak. (c) Absorption spectrum of 400-nm elution peak at 9.1 min. (d) Absorption spectrum of 400-nm elution peak at 15.3 min, showing α, β, and Soret absorption bands.

