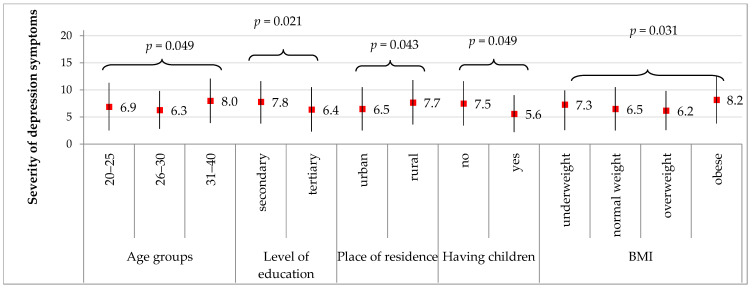
Figure 5.
Significant correlations for the severity of depression symptoms acc. to HADS with socio-demographic characteristics in the PCOS group. Results are presented as mean ± standard deviation. p for Student’s t test or F test of analysis of variance. In the PCOS group, severity of depression symptoms did not correlate with p for Student’s t test for level of education, place of residence, marital status, and having had children. p for F test analysis of variance for age groups, BMI groups.

