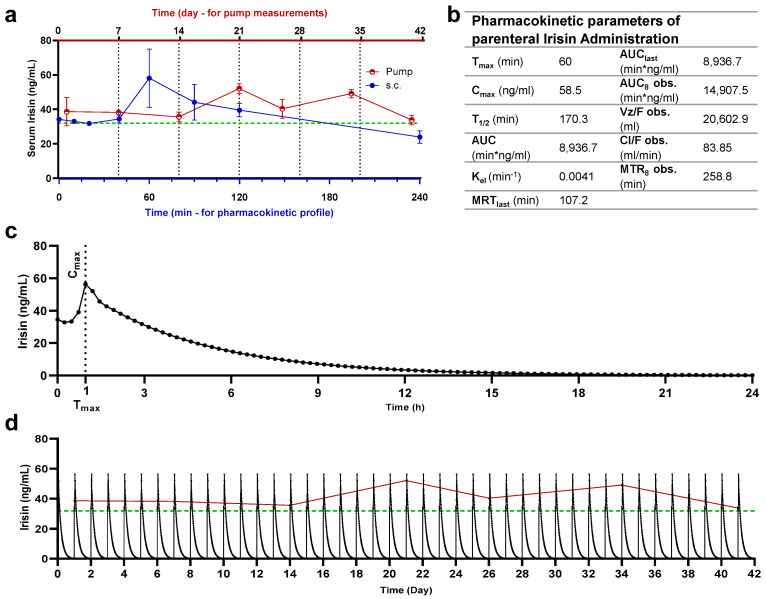
Figure 3.
Relative and simulation-generated pharmacokinetic profiles of irisin. (a) Serum sampling and irisin quantification of irisin administered via the osmotic pump (upper x-axis—red) and subcutaneous route (bottom x-axis—blue) in Sprague Dawley rats, as well as baseline levels measured in control animals (dashed line—green). Irisin quantification was made at specific time intervals after administration: weekly during 42 days of osmotic pump release for rats receiving irisin via a pump and 4 h from the subcutaneous injection (min); (b) pharmacokinetic parameters of irisin in Sprague Dawley rats receiving irisin via the subcutaneous route; (c) simulated kinetic profile of single-dose subcutaneous administration; (d) repeated for 42 days with pump readings plotted with baseline levels of control animals (dashed line—green) and pump-released irisin levels (continuous line—red).

