Figure 4.
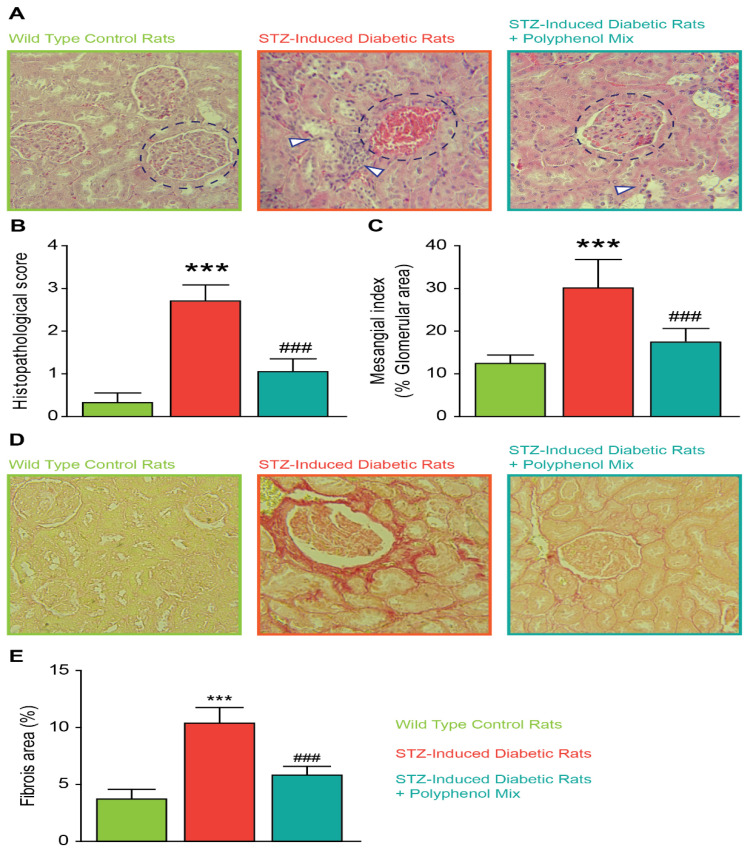
Renal histopathology and quantification. (A) Kidney architecture in STZ-induced diabetic rats. Histological examination (H&E stained) (400×) in rat kidney of normal group, STZ-induced diabetic group, untreated or treated with the polyphenol mix NCQ. Control kidney section showing normal histological features of glomeruli and tubules (labelled in green). STZ-induced diabetic rat’s kidney showing glomerular degeneration and hypercellularity (labelled in orange). Most of the cortical tubules showed morphologic changes, some of them being tubular necrosis, degeneration of tubular epithelium with interstitial hemorrhage. STZ-induced diabetic rats treated with NCQ (labelled in bleu) showing more remarkable improvement and the glomeruli were normal while renal tubules showed mild necrosis. Bowman’s capsules are highlighted in blue circles in all condition while necrotic cells and tubular epithelium labelled with white arrows. (B) Graph showing total histology scores for inflammation and fibrosis in each group. (C) The mesangial matrix index was defined as the proportion of the glomerular tuft occupied by the mesangial matrix area (excluding nuclei). (D) Renal interstitial structure (picrosirius red stained) and (E) fibrosis area in each group. ImageJ software (ImageJ version 1.3v; NIH, Bethesda, MD) was used to calculate the percent area of each image that stained positive for Sirius Red. Data are expressed as means ± SEM. *** p < 0.001, when the control group is compared to STZ-induced diabetic rats group and ### p < 0.001 when STZ untreated rats are compared to NCQ-treated group.

