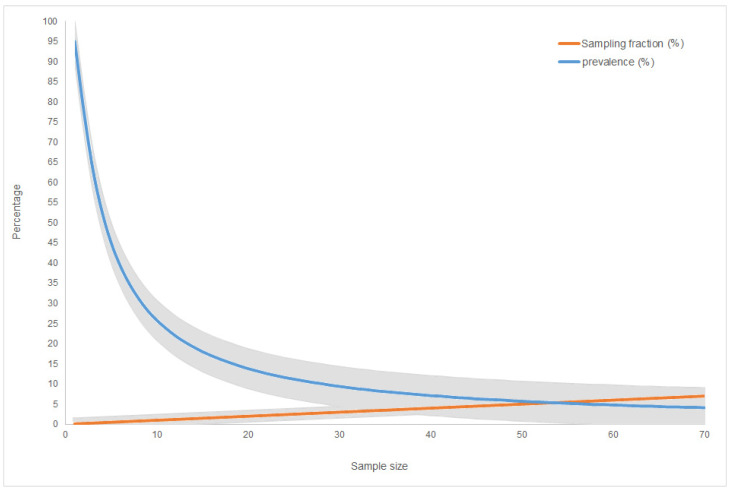
Figure 4.
Graphical representation of the minimum ASF-negative carcasses (sample size) corresponding to the sampling fraction (%) of the overall population of the estimated carcasses and the disease prevalence (%) that could be excluded by the carcasses when assuming a maximum overall population of 2000 carcasses. The grey bands represent the 95% confidence limits.

