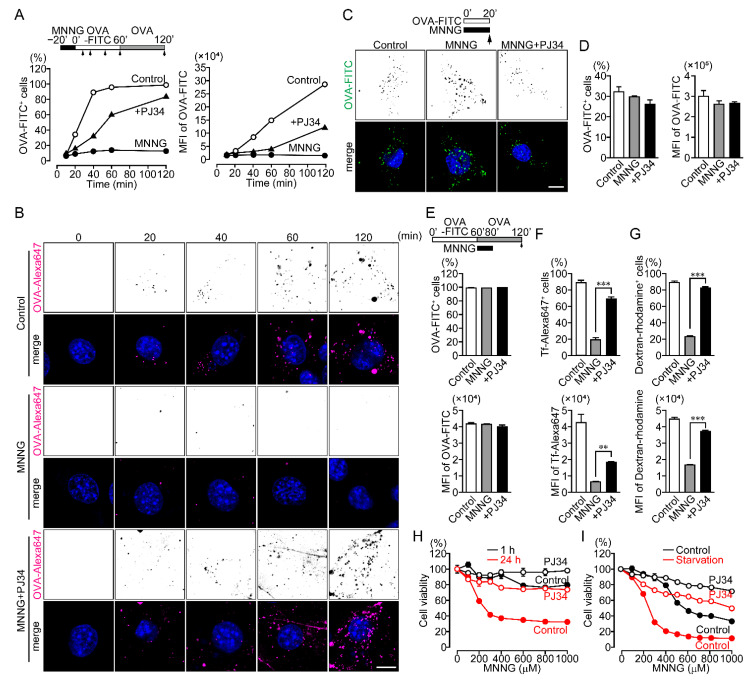
Figure 2.
PARP1-dependent inhibition of endocytosis results in cell death. (A) Time course of OVA-FITC uptake (the percentages of OVA-FITC+ cells (left) and MFI of OVA-FITC in NIH3T3 cells (right)). NIH3T3 cells were pretreated with or without PJ34 (10 μM) for 10 min, then exposed to MNNG (500 μM, 20 min), after which they were incubated with OVA-FITC (50 μg/mL) then chased with OVA (100 μg/mL) for the indicated times. Shown are means ± SEM (n = 3). p < 0.05 at >20 min (left) and >60 min (right). (B) Subcellular localization of OVA-Alexa647. NIH3T3 cells were pretreated with or without PJ34 (10 μM) for 10 min and then exposed to MNNG (500 μM, 20 min) before incubation with OVA-Alexa647 (50 μg/mL) and chased with OVA (100 μg/mL) for the indicated times. Scale bar: 10 μm. (C) OVA-FITC uptake following simultaneous exposure to MNNG and OVA-FITC. NIH3T3 cells were pretreated with or without PJ34 (10 μM) for 10 min, then exposed to MNNG (500 μM) and OVA-FITC (50 μg/mL, green) for 20 min. Nuclei were stained with DAPI (blue). Scale bar: 10 μm. (D) Effect of simultaneous addition of MNNG and OVA-FITC on OVA-FITC uptake. With the same procedure as in panel (C), OVA-FITC+ cells (left) and MFI of OVA-FITC (right) were counted using flow cytometry. Shown are means ± SEM (n = 3). (E) Effect of endosomal recycling on OVA-FITC uptake (the percentages of OVA-FITC+ cells (upper) and MFI of OVA-FITC in NIH3T3 cells (lower)). After incubation with OVA-FITC (50 μg/mL, 1 h), NIH3T3 cells were exposed to MNNG (500 μM, 20 min) with OVA (100 μg/mL, 1 h). Shown are means ± SEM (n = 3). (F) Tf-Alexa647 uptake (the percentages of Tf-Alexa647+ cells (upper) and MFI of Tf-Alexa647 in NIH3T3 cells (lower)). NIH3T3 cells were exposed to MNNG (500 μM, 20 min) before incubation with Tf-Alexa647 (15 μg/mL, 1 h). Shown are means ± SEM (n = 3).** p < 0.01, *** p < 0.001 (G) Dextran-rhodamine uptake (the percentages of Dextran-rhodamine+ cells (upper) and MFI of Dextran-rhodamine in NIH3T3 cells (lower)). NIH3T3 cells were exposed to MNNG (500 μM, 20 min) before incubation with dextran-rhodamine (50 μg/mL, 1 h). Shown are means ± SEM (n = 3). *** p < 0.001 (H) Short- and long-term cytotoxic effects of MNNG. NIH3T3 cells were pretreated for 10 min with or without PJ34 (10 μM) before cell viability was measured after 1-h (black) or 24-h (red) exposure to MNNG at the indicated concentrations. Shown are means ± SEM (n = 3). p < 0.001 between 1-h and 24-h at concentrations > 100 μM in control group. (I) MNNG-induced cytotoxicity during starvation. NIH3T3 cells were pretreated for 10 min with or without PJ34 (10 μM), then exposed to MNNG (20 min) at the indicated concentrations before incubation for 24 h in serum-containing (black) or serum-free (red) medium. Shown are means ± SEM (n = 3). p < 0.001 between control and starvation at concentrations >100 μM in the control group. Data information: Panels (A,H,I): two-way ANOVA with post hoc Tukey’s test; (D–G): one-way ANOVA with post hoc Tukey’s test.

