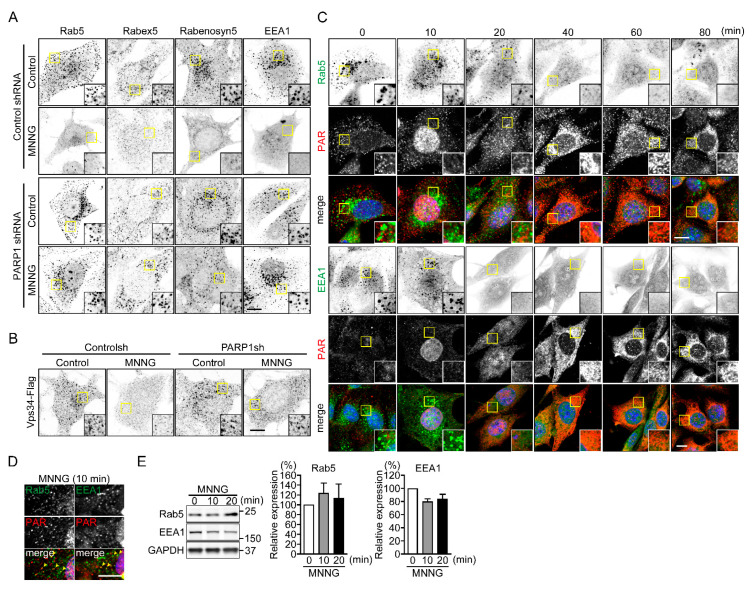
Figure 3.
PARP1 dissociates Rab5 and its effector proteins from EE. (A) Subcellular localization of Rab5 and its effector proteins following exposure to MNNG. After exposure to MNNG (500 μM, 20 min), NIH3T3 cells were stained with the indicated antibodies. Scale bar: 10 μm. (B) Subcellular localization of Vps34-Flag following exposure to MNNG. After exposure to MNNG (500 μM, 20 min), NIH3T3 cells were stained with anti-Flag antibodies. Scale bar: 10 μm. (C) Time-dependent changes in subcellular localization of PAR, Rab5 and EEA1 following exposure to MNNG. After exposure to MNNG (500 μM), NIH3T3 cells were stained with anti-Rab5 (green in left panels) or anti-EEA (green in right panels) and anti-PAR (red) antibodies. Nuclei were stained with DAPI. Scale bar: 10 μm. (D) Cytoplasmic PAR localization. After exposure to MNNG (500 μM, 10 min), NIH3T3 cells were stained with anti-Rab5 (green, left panel) or anti-EEA1 (green, right panel) and anti-PAR (red) antibodies. Arrowheads indicate colocalization of PAR and Rab5 or EEA1 within the cytoplasm. Nuclei were stained with DAPI. Scale bar: 10 μm. (E) Expression of early endosomal proteins (Rab5 (left) and EEA1 (right)). After exposure to MNNG (500 μM) for indicated times, NIH3T3 cells were subjected to Western blotting using indicated antibodies. Protein levels were normalized to GAPDH. Shown are means ± SEM (n = 3). Data information: Panel (E): one-way ANOVA with post hoc Tukey’s test.

