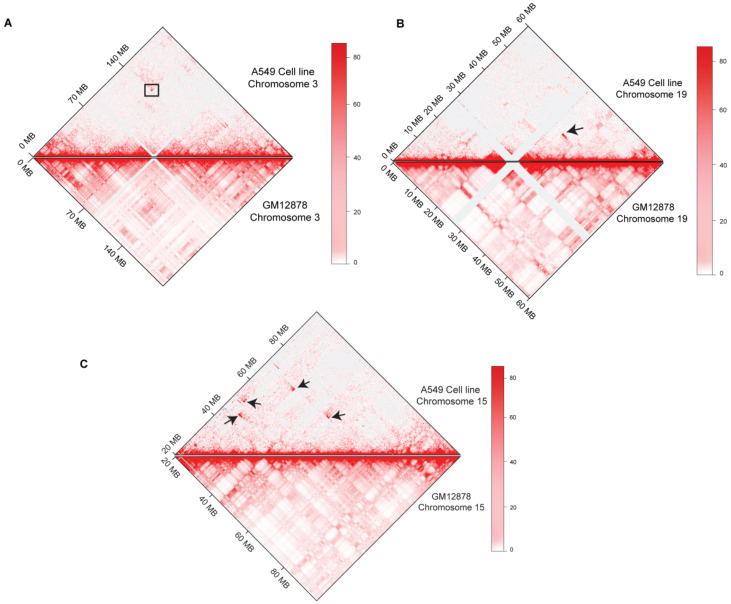
Figure 3.
Differential Rearrangements at the chromosomal level in A549 cell line. Comparison between A549-Cell line (Upper panel) and Normal GM12878 (Lower panel) Hi-C at chromosomal level is shown (A) chromosome 3, (B) Chromosome 15, and (C) Chromosome 19. Changes are marked with black arrows and box.

