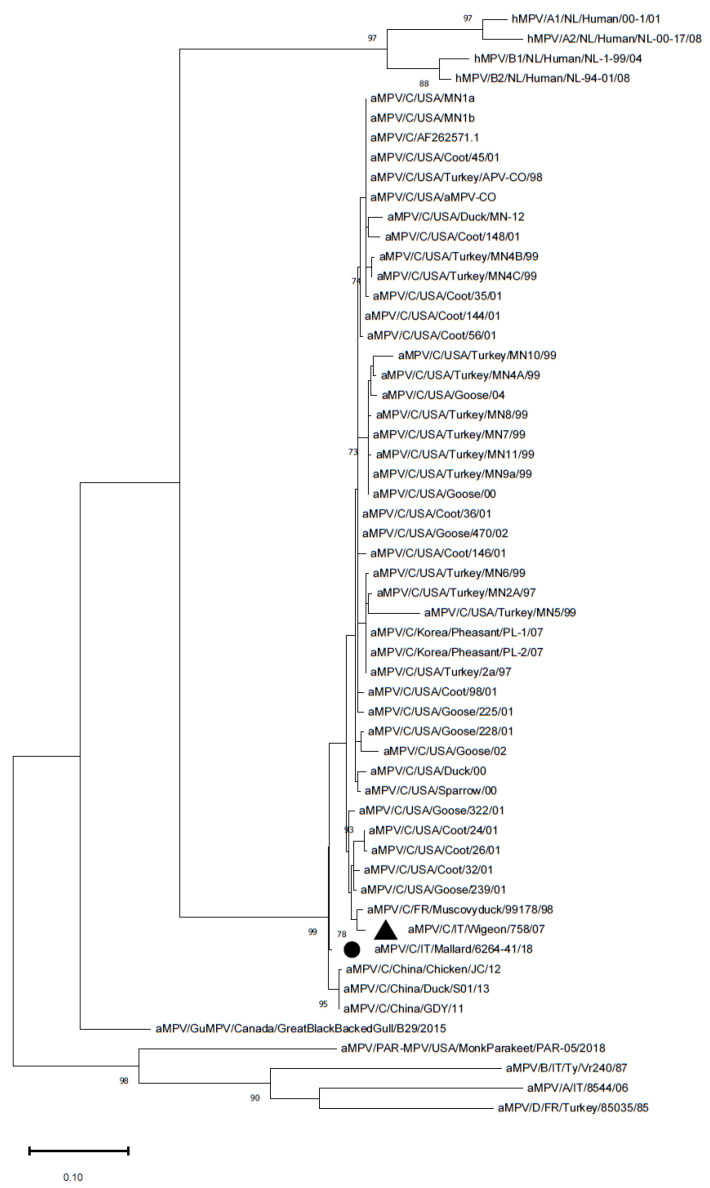
Figure 1.
Phylogenetic tree reconstructed using the M gene of aMPV strains from Supplementary Table S1. The Italian mallard strain is marked with a black circle, whereas the previously detected Italian strain is marked with a black triangle. The tree was reconstructed using the Maximum Likelihood method and Tamura 3-parameter model with discrete Gamma distribution. Bootstrap support (>70%) is shown next to the branches. The tree is drawn to scale, with branch lengths measured in the number of substitutions per site. This analysis involved 56 nucleotide sequences. All of the positions containing gaps and missing data were eliminated. The final dataset was composed of 358 positions.

