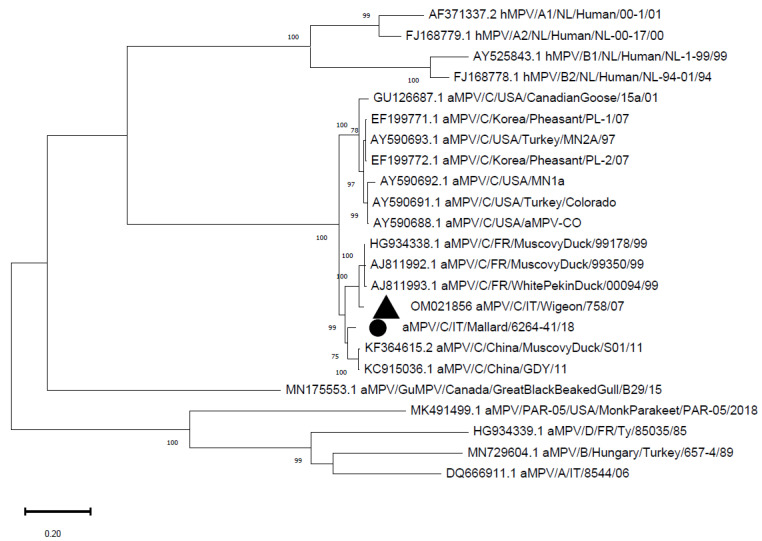
Figure 2.
Phylogenetic tree reconstructed using the G gene of aMPV strains from Supplementary Table S2. The Italian mallard strain is marked with a black circle, whereas the previously detected Italian strain is marked with a black triangle. The tree was reconstructed using the Maximum Likelihood method and Hasegawa-Kishino-Yano model with discrete Gamma distribution (G) and a proportion of invariable sites (I). Bootstrap support (>70%) is shown next to the branches. This analysis involved 23 nucleotide sequences. All of the positions with less than 95% site coverage were eliminated. The final dataset was composed of 502 positions.

