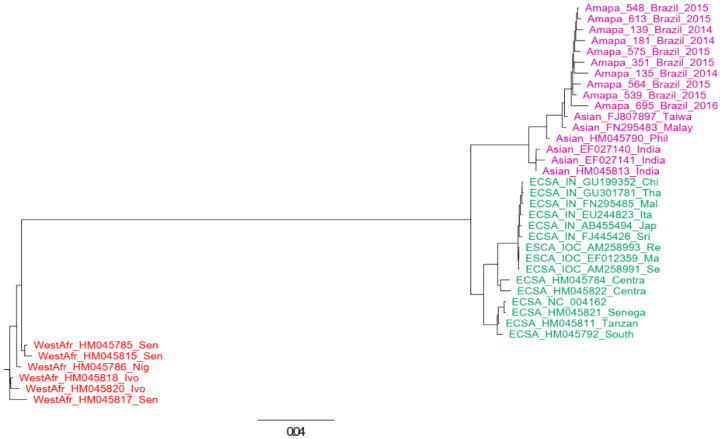
Figure 2.
Genotyping tree of CHIKV. The tree was constructed using complete genomes of CHIKV. The maximum likelihood approach was used and the model GTR was assumed in this inference. Sequences of Asian lineage are indicated in magenta, those of West African lineage are in red, and those of ECSA are indicated in green. The horizontal bar indicates the nucleotide substitution per base.

