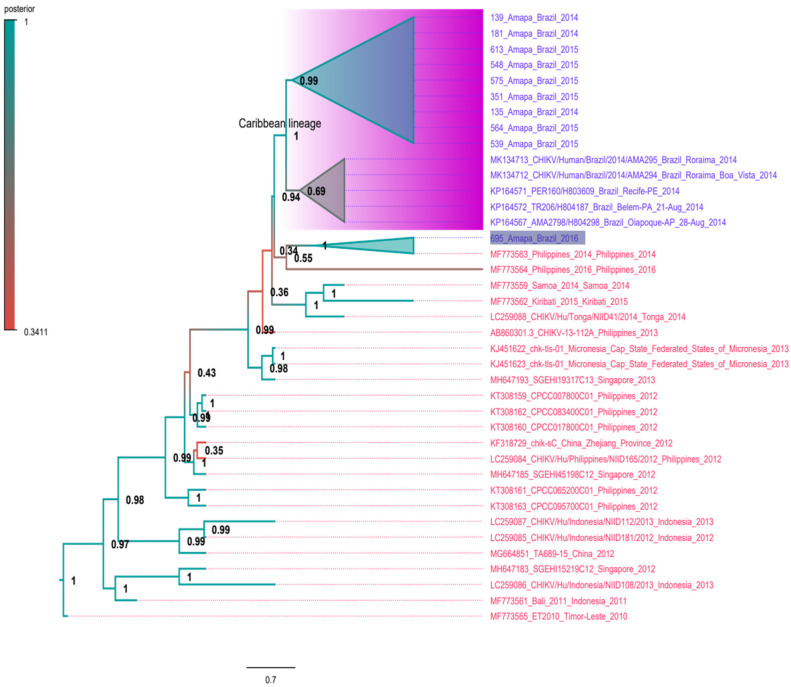
Figure 5.
Time-scaled tree of CHIKV-Asian. The tree was constructed using complete genomes of CHIKV. The coalescent constant population size approach was used and the model TN-93 was assumed in this inference. Sequences of Asian/Oceania are indicated in red color and Brazilian sequences are in blue color. The Caribbean lineage is also indicated in the magenta rectangle. The sequence 695_Amapá is highlighted. Numbers in the nodes indicate the posterior probability. The horizontal bar indicates the nucleotide substitution per base.

