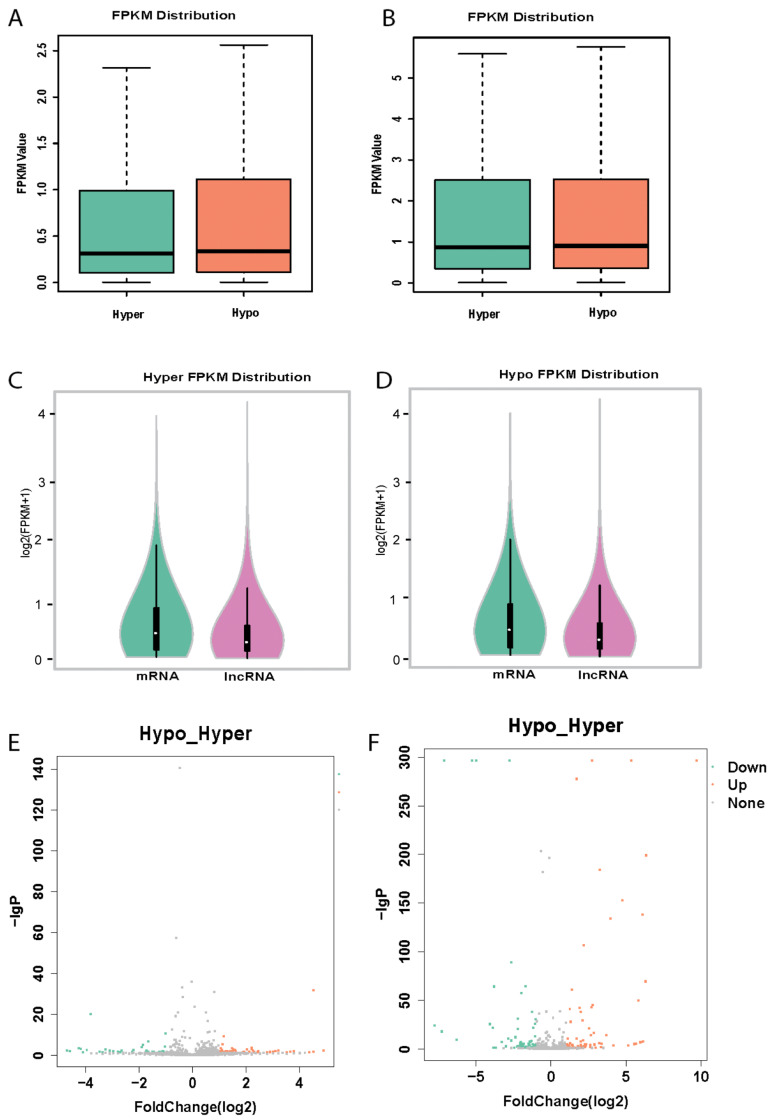
Figure 1.
LncRNAs and their expression changes in platelets determined by the RNA-seq data set. (A) Box plot showing the distribution of the FPKM (fragments per kilobase of exon per million fragments mapped) values of known lncRNAs. (B) Box plot showing the distribution of the FPKM of novel lncRNAs. (C) Compare the mRNA and lncRNAs distribution in hyperreactive platelets. (D) Compare the mRNA and lncRNAs distribution in hyporeactive platelets. (E) Volcano plot of differentially expressed known lncRNAs between hyperreactive and hyporeactive platelets Down or up mean lower or overexpression in hyporeactive platelets compared to hyperreactive platelets (Hypo vs. Hyper). (F) Volcano plot of differentially expressed novel lncRNAs (Hypo vs. Hyper). Red dots represent up expressed RNAs and green dots represent down expressed RNAs with at least two-fold change and corrected p-value <0.05. Orange and cyan dots indicate significantly upregulated and downregulated lncRNAs, respectively.

