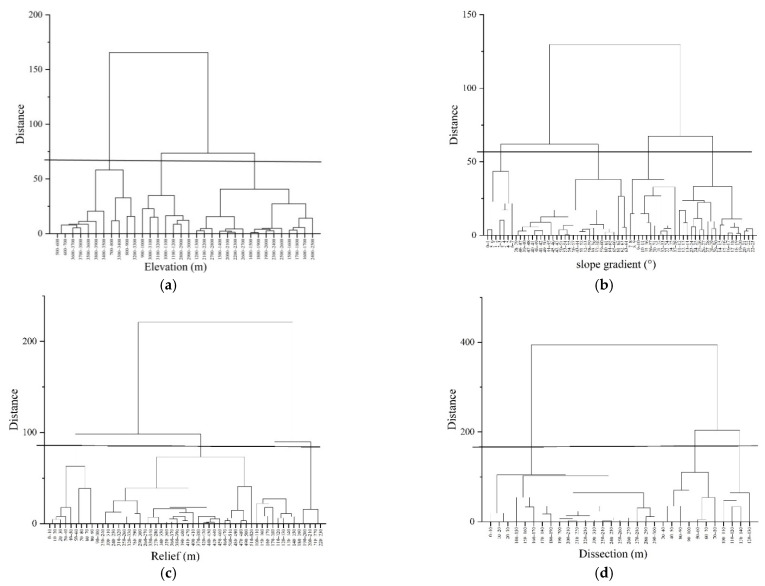
Figure 2.
Tree diagram of hierarchical clustering in topographic factors. The horizontal line in the figure is the distance value for classification. The closer the distance, the more similar the gully erosion forms in the topographic range classification. (a) Tree diagram of hierarchical clustering in elevation; (b) Tree diagram of hierarchical clustering in slope gradient; (c) Tree diagram of hierarchical clustering in relief; (d) Tree diagram of hierarchical clustering in dissection.

