Figure 3.
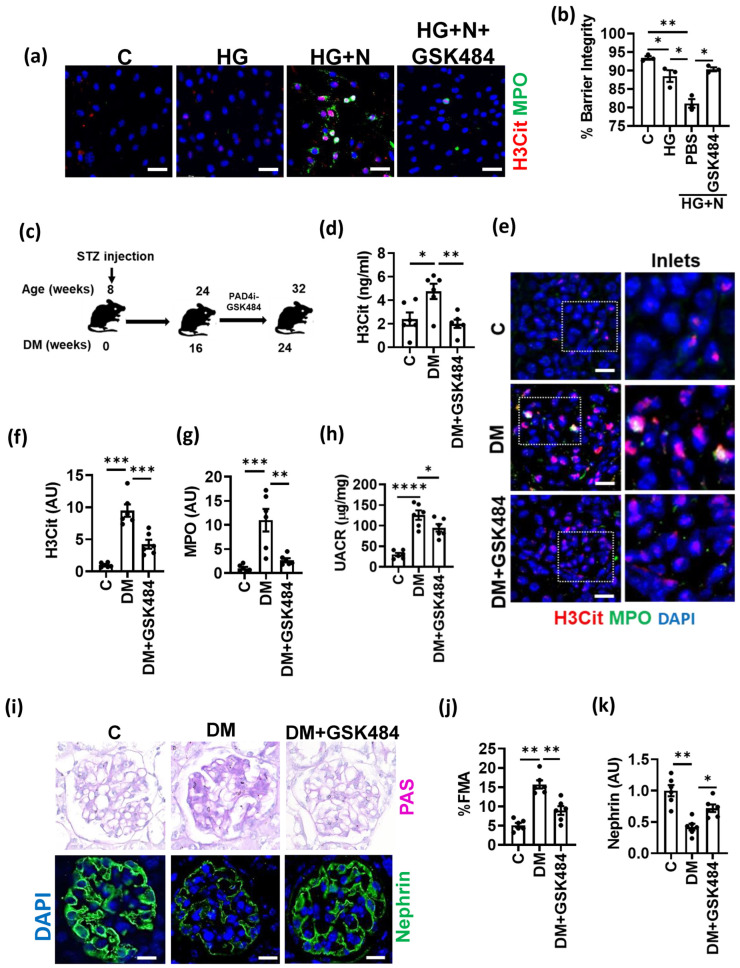
PAD4 inhibition ameliorates NET formation and experimental DKD. (a) Representative immunocytochemical images for NET markers MPO (green) and H3Cit (red) on mGENCs exposed to high glucose alone (HG, 25 mM), HG and neutrophils without (HG+N) or with the PAD4 inhibitor GSK484 (HG+N+GSK484) compared to control (C, 5 mM glucose, not neutrophils) mGENCs. (b) Bar graph summarizing barrier integrity of the in vitro GFB model. Effect of GSK484-mediated NET inhibition in the presence of high glucose and neutrophils (HG+N+GSK484) compared to control (C), high glucose alone (HG), or HG+N stimulation without GSK484 (PBS). (c) Schematic representation of experimental approach of treatment with the PAD4-inhibitor (PAD4i) GSK484 in type-1 diabetic mice (streptozotocin model, STZ) after 16 weeks of established hyperglycemia. (d–g) Plasma NET markers ((d), ELISA, bar graph summarizing results) and NET markers in glomeruli ((e), representative immunostaining for H3Cit, red and MPO, green; (f,g), bar graph summarizing results) in non-diabetic control (C) and diabetic mice without (DM) or with (DM+GSK484) treatment. (h–k) UACR (h), fractional mesangial area ((i), top; (j), bar graph summarizing results) and nephrin expression ((i), bottom, green, DAPI nuclear counterstain, blue; (k), bar graph summarizing results) after diabetic mice with (DM+GSK484) or without (DM) GSK484 treatment compared to non-diabetic control mice (C). n = 3 independent repeat experiments (a,b) or n = 6 mice each group (d–k); (e,i): Scale bar, 50 μm; (b,f,g,h,j): * p < 0.05, ** p < 0.01, *** p< 0.001, **** p< 0.0001, ANOVA.

