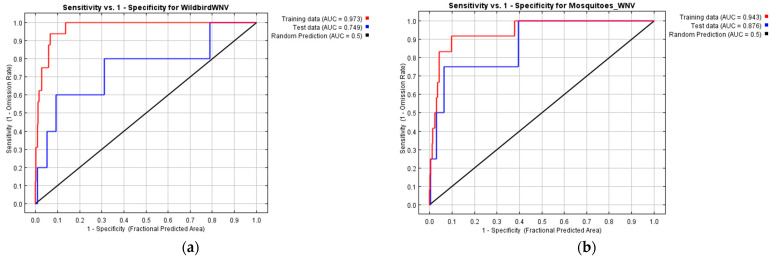
Figure 2.
ROC curves depicting the performances of MaxEnt models (red line: training data; blue line: testing data; black line: random prediction): (a) Wild birds WNV model; the Area Under the Curve (AUC) had a value of 0.973 for training data and 0.749 for testing data and exceeded the value of random prediction (AUC = 0.5); (b) Mosquito WNV model; the Area Under the Curve (AUC) had value of 0.943 for training data and 0.876 for testing data and exceeded the value of random prediction (AUC = 0.5).

