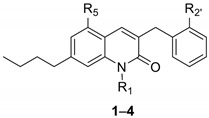
Table 1.
Radioligand binding assays on hGPR55 and hCBRs a.

| ||||||
|---|---|---|---|---|---|---|
| Compound | R1 | R5 | R2′ | Ki hGPR55 (nM) | Ki hCB1R (nM) | Ki hCB2R (nM) |
| CP55,940 | 13 (9.4–19) | 12 (5.8–26) | 128 (14–58) | |||
| O-1602 | 10 (7.6–14) | - | - | |||
| 1 | H | OCH3 | OCH3 | 14 (8.1–24) | >10,000 | >10,000 |
| 2 | CH3 | OCH3 | OCH3 | 1.2 (0.58–3.3) * | >10,000 | 6.9 (2.4–17) |
| 3 | H | OH | OH | 6.2 (4.6–8.4) * | 5.1 (1.0–26) | >10,000 |
| 4 | CH3 | OH | OH | 7.1 (6.0–8.4) * | 29 (14–65) | 7.9 (4.8–13) |
a Affinity (Ki) was estimated for each compound using cell membranes (25 µg/sample) derived from CHO cells expressing either human GPR55, CB1R or CB2R. Membranes were incubated with 1 nM [3H]CP55,940 and 0.1–10 µM of each compound for 2 h and radioactivity was measured as previously described [27]. Data were fit to a 3-parameter non-linear regression in GraphPad (v. 9.0). Data are means with 95% confidence interval (CI). n = 3–4 independent experiments. Statistical analyses were by non-overlapping CI. * p < 0.05 relative to GPR55 within compound. Concentration-response curves are shown in Figure 3.
