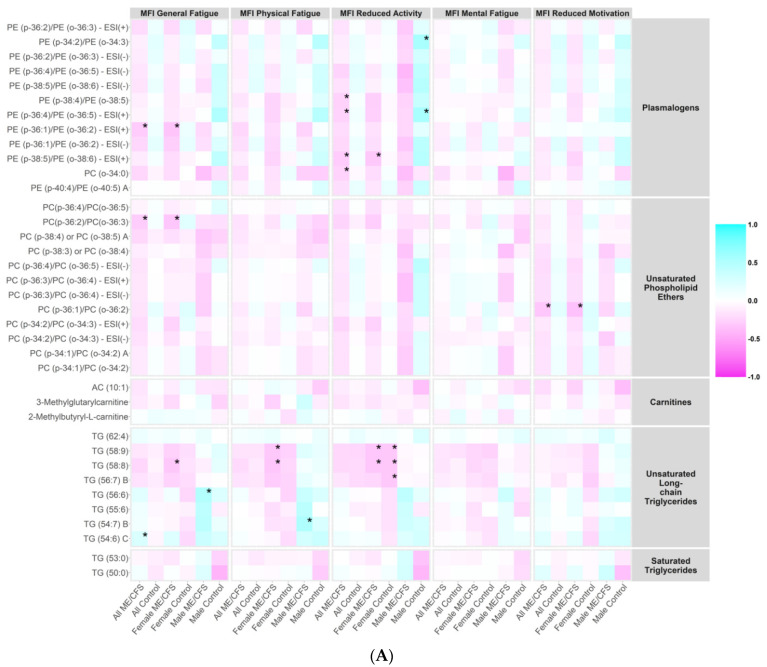
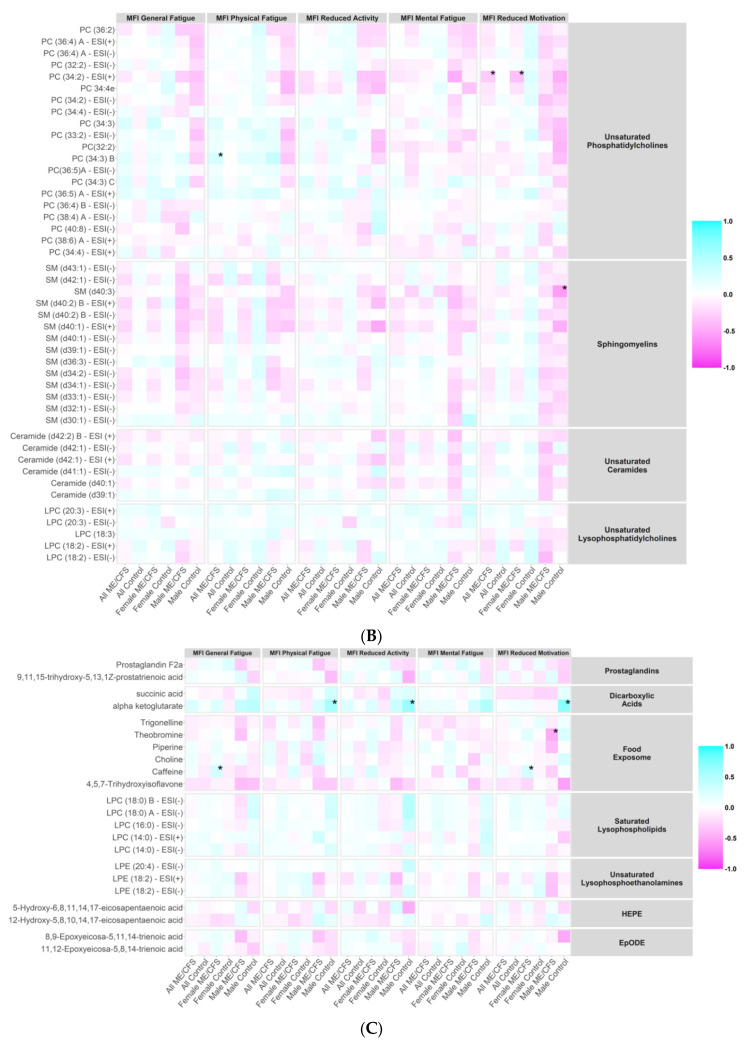
Figure 4.
Correlation heatmap. MFI, Multidimensional Fatigue Inventory scored on 0–100 scale with 0 = no fatigue and 100 = maximal fatigue. ME/CFS: myalgic encephalomyelitis/chronic fatigue syndrome. * p < 0.01. Heatmap showing the correlation coefficients between the plasma levels of metabolites in the metabolic clusters that were significantly altered in ME/CFS (bold in Supplementary Table S4) and MFI scales using Spearman’s correlation tests in all ME/CFS, all controls, female ME/CFS, female controls, male ME/CFS, and male controls. (A) Correlation heatmap, part 1. (B) Correlation heatmap, part 2. (C) Correlation heatmap, part 3.


