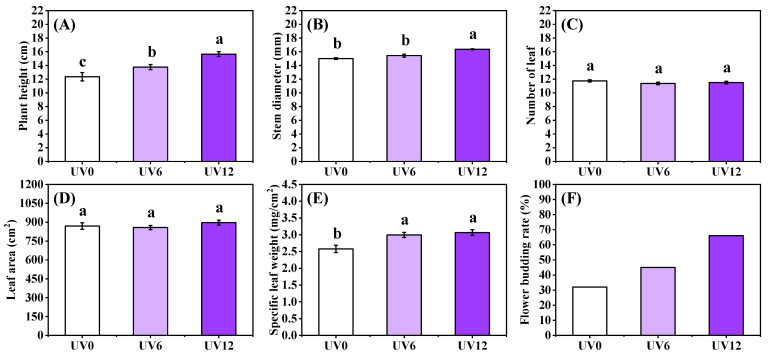
Figure 2.
Morphology of Chinese kale exposed to different durations of UVA-radiation exposure. (A) Plant height (PH). (B) Stem diameter (SD). (C) Number of leaves (LN). (D) Leaf area (LA). (E) Specific leaf weight (SLW). (F) Flower budding rate. Different lowercase letters (a–c) labeled on the vertical bar (means ± standard error, n = 8) represent significant differences by one-way ANOVA with multiple-range tests (p ≤ 0.05).

