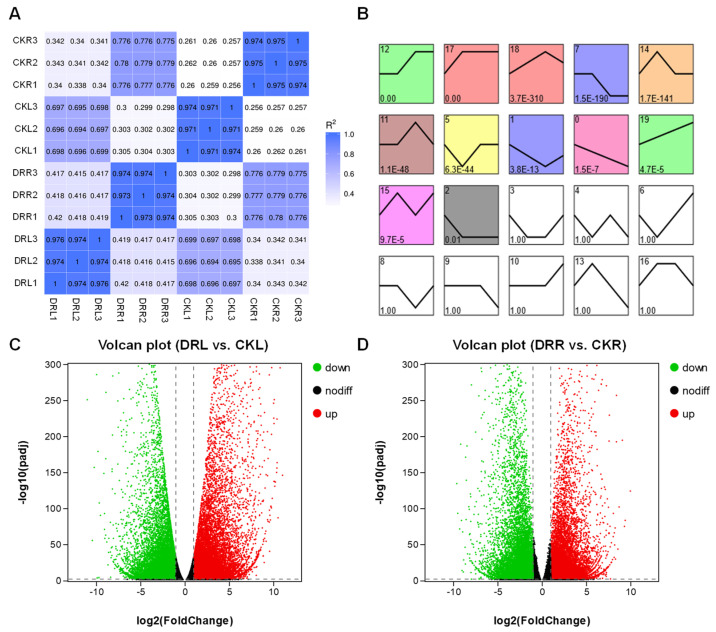
Figure 2.
Differentially expressed genes in L. multiflorum leaves and roots under drought. (A) Pearson correlation coefficients between all samples. CKL and CKR represent leaves and roots under normal control conditions, respectively. DRL and DRR represent leaves and roots under drought stress, respectively. (B) Profiles ordered based on the P-value of genes assigned versus expected results. (C) Volcano plot of DRL versus CKL. (D) Volcano plot of DRL versus CKL. Green represents down-regulated expression, red represents up-regulated expression, and black indicates no significant difference.

