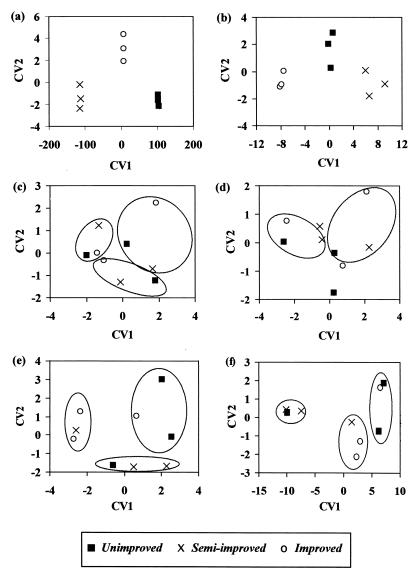
FIG. 3.
Ordination of canonical variates (CV1 and CV2) produced from multivariate analysis of DGGE banding data from triplicate samples of three grassland soils. (a, c, and e) Analysis of an unweighted matrix; (b, d, and f) analysis of the corresponding weighted data. Panels a and b show the true grouping of the original data into unimproved, semi-improved, and improved soils, while panels c to f show analysis of data that were randomly grouped prior to analysis (see Materials and Methods). The points on all graphs indicate the grassland types, and the three random groups of data for each set are circled in panels a to d and f; in panel e only two sets of data are clearly marked. CV1 accounts for 99.9, 96.5, 73.9, 89.2, 94.0, and 98.2% of the variation in panels a to f, respectively, and CV2 accounts for 0.1, 3.5, 26.1, 10.8, 6.0, and 1.8% of the variation, respectively.

