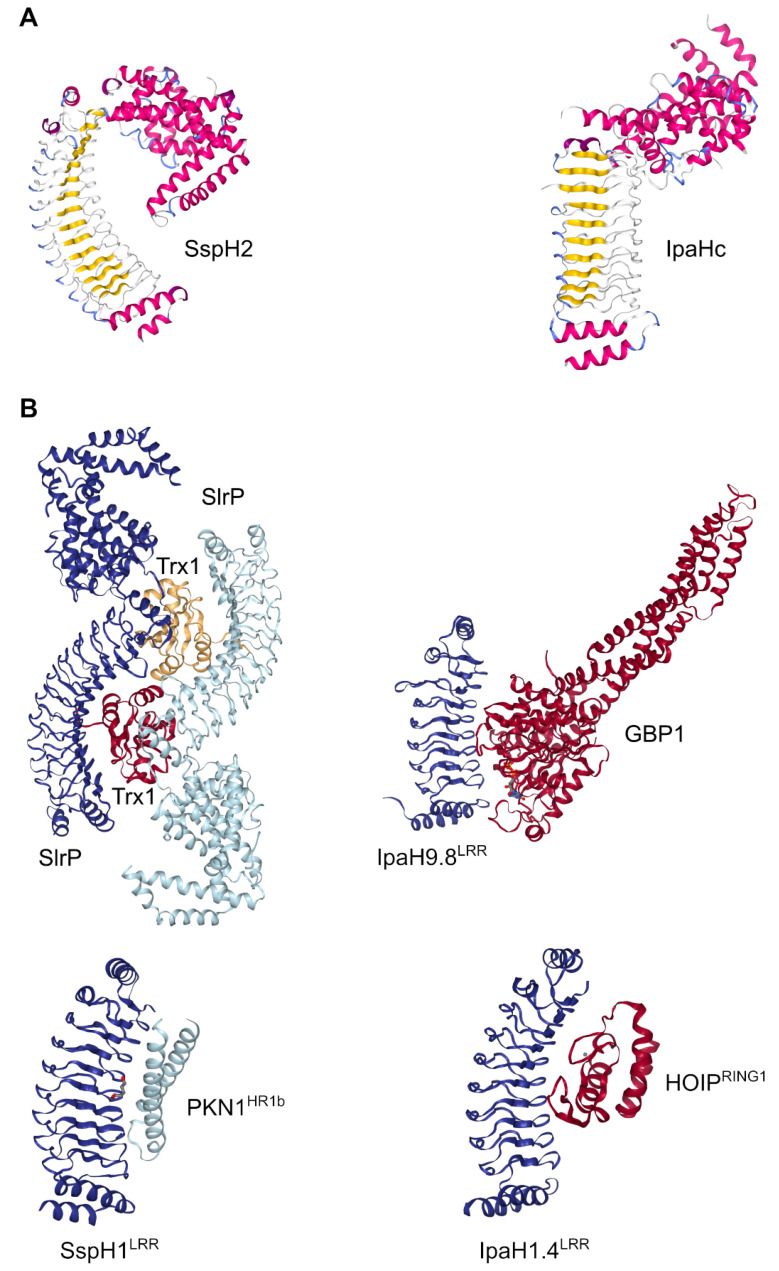
Figure 4.
Crystal structures of NEL E3 ligases. (A) Examples of the two autoinhibition modes: SspH2, mode 1 (PDB ID: 3G06) [108]; IpaHc, mode2 (PDB ID: 3CVR) [56]. Colors are set according to secondary structure. (B) E3 ligases in complex with their substrates: SlrP (blue) in complex with Trx1 (red and yellow) (PDB ID: 4PUF) [179]; the LRR domain of SspH1 (dark blue) in complex with the HR1b domain of PKN1 (light blue) (4NKG) [186]; the LRR domain of IpaH9.8 (blue) in complex with GBP1 (red) (PDB ID: 6LOJ) [185]; and the LRR domain of IpaH1.4 (blue) in complex with the RING1 domain of HOIP (red) (PDB ID: 7V8G) [187]. Drawings created with NGL [191].

