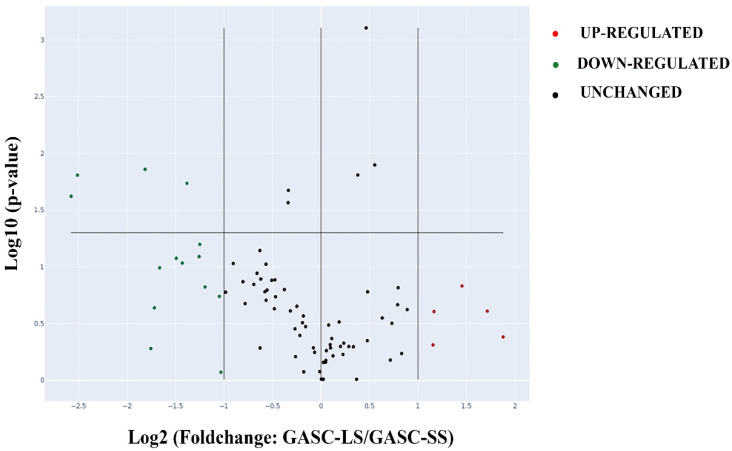
Figure 1.
Comparison of the gene expression profile of GASC-LS (n = 6) versus GASC-SS (n = 5), using a customized RT2 PCR Array. Volcano plot shows the gene expression changes of 78 protein-coding transcripts analyzed using the RT2 Profiler™ PCR Array. The volcano plot highlights significant gene expression changes by plotting the log2 of the fold changes in gene expression on the x-axis versus their statistical significance on the y-axis. The center vertical line indicates unchanged gene expression, while the two outer vertical lines indicate the selected fold regulation threshold (abs (≥2)). The horizontal line indicates the selected p-value threshold (p ≤ 0,05). Genes with data points in the far upper left (down-regulated, green dots) and far upper right (up-regulated, red dots) sections meet the selected fold regulation and p-value thresholds.

