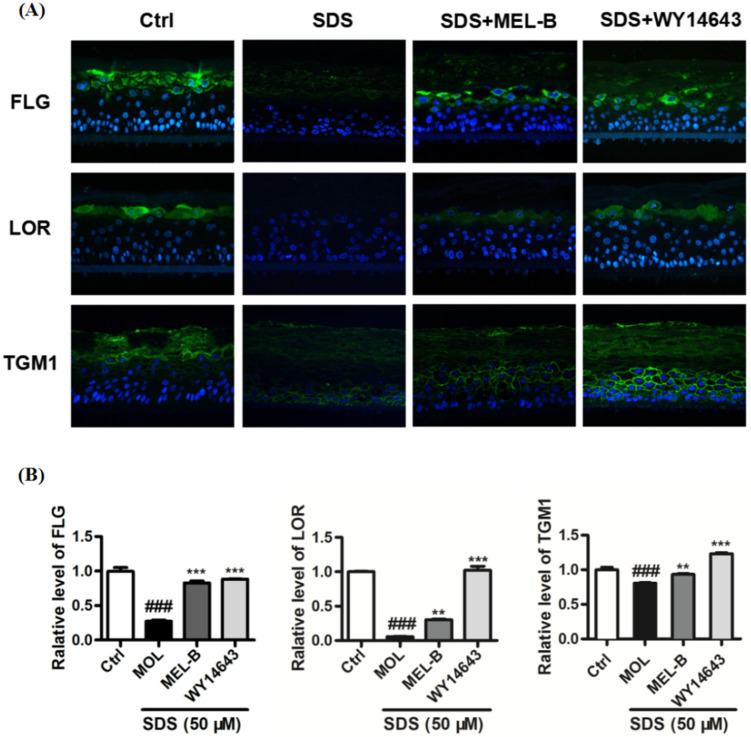
Figure 7.
Effects of MEL-B treatment on SDS-induced EpiKutis®3D human skin cells as assessed via immunofluorescence staining, with blue-stained areas corresponding to nucleus and yellow–green-stained areas corresponding to cell membrane. WY14643 (50 μM) was used as the positive control drug in the experiment. (A) Expression of key proteins were analyzed and treated with MEL-B (20 μg/mL) for 24 h in EpiKutis®3D human skin cells by a confocal microscope. Scale bar = 100 μm. (B) Relative expression levels of FLG, LOR, TGM1 were significantly increased after MEL-B incubation as compared to the corresponding levels observed in the SDS-induced group (Mol). Values are expressed as means ± SD (n = 3). ### p < 0.001 vs. the control group (Ctrl); ** p < 0.01, *** p < 0.001 vs. the SDS-induced (Mol) group.

