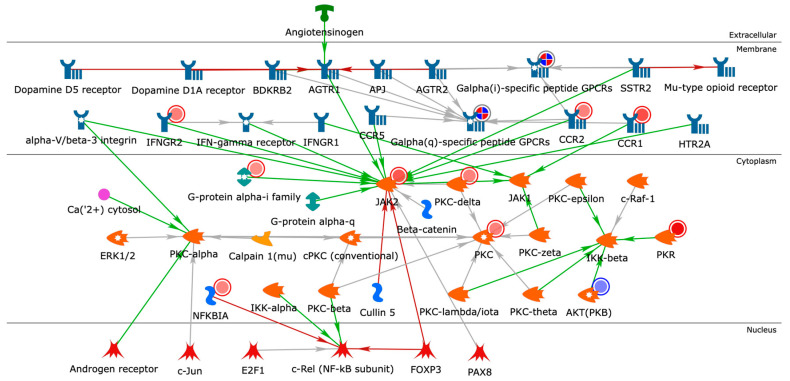
Figure 5.
Closest-neighbor network of the identified drug targets for CMap compound hits. Objects/nodes = proteins, transcription factors, compounds, ions, reactions; blue-encircled objects = seed/input nodes; arrows = interactions; green arrows = activation; red arrows = inhibition; grey arrows = unspecified interaction; solid red circles = upregulation; solid blue circles = downregulation. Darker red represents higher upregulation of gene expression (higher log2FC); darker blue represents lower downregulation of gene expression (lower log2FC).

