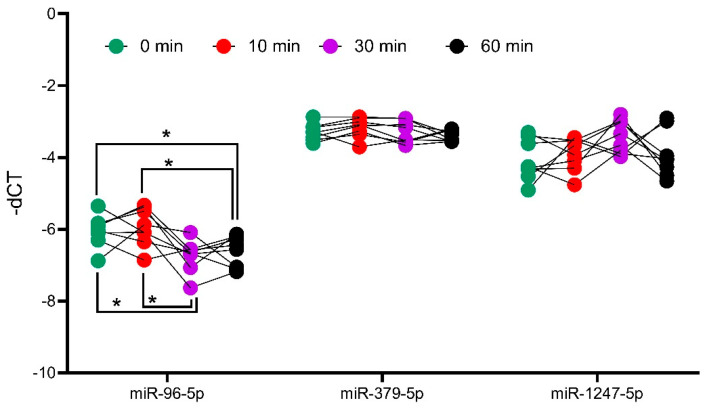
Figure 5.
Analysis of miRNA expression in ACTH stimulated mice tissue. QPCR analyses of positive controls, miR-96-5p, and candidates miR-379-5p and miR-1247-5p. Mice were injected with ACTH, and adrenals were collected at different timepoints to assess the impact of ACTH on miRNA expression. Data are represented as mean ± standard deviation (SD) of −dCT values. Housekeeping gene: miR-26a-5p. Statistics: ANOVA test with Bonferroni correction to detect significant differences between patient groups with at least a significance of p-value < 0.05 (*).

