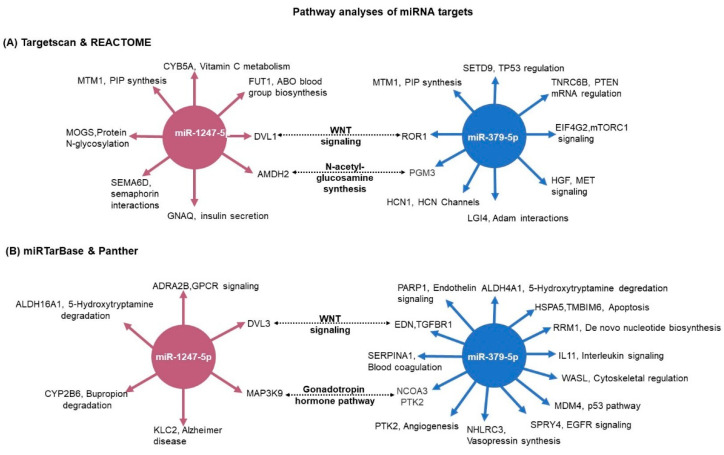
Figure 9.
Pathway analyses of miRNA target genes. (A) The predicted targets were matched with the RNA-seq expression data. For miR-1247-5p, CPA vs. controls expression data; and for miR-379-5p, PBMAH vs. controls expression data. The significantly expressed target genes were then subjected to pathway analyses by Reactome. The significantly enriched pathway networks (p < 0.05) and their related genes are given. (B) The experimentally validated target genes from miRTarBase were analyzed for their role in pathways by the Panther database. The target genes and their related pathways are given. The commonly represented pathways are marked in bold.

