
Figure 5.
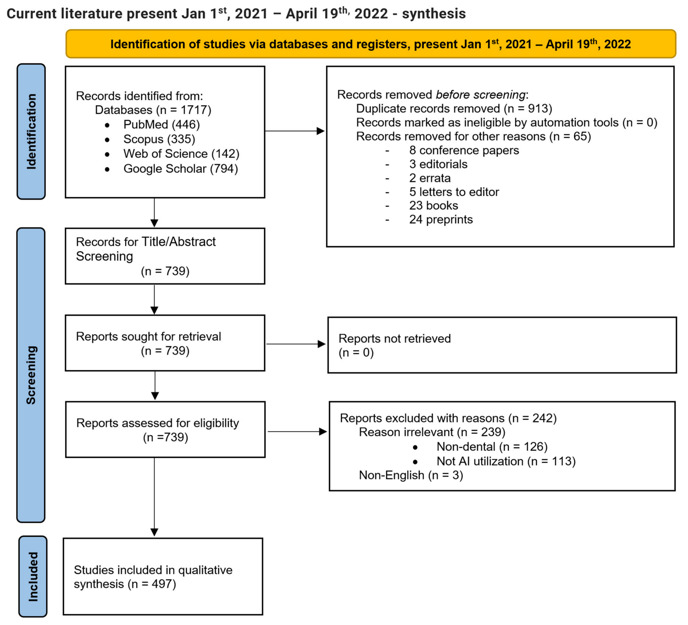
The PRISMA flow chart diagram depicts the flow of information through the different phases of a systematic review. It maps out the number of records identified, included, and excluded, and the reasons for exclusions. Different templates are available depending on the type of review (new or updated) and sources used to identify studies.