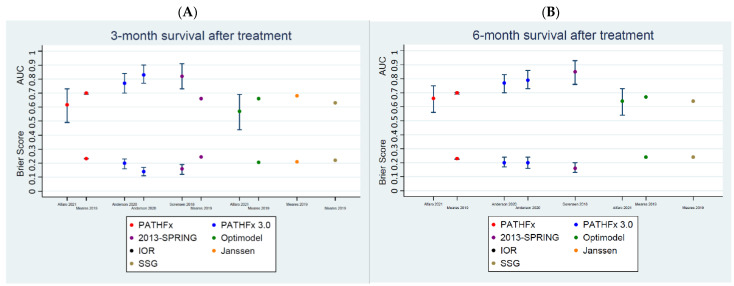
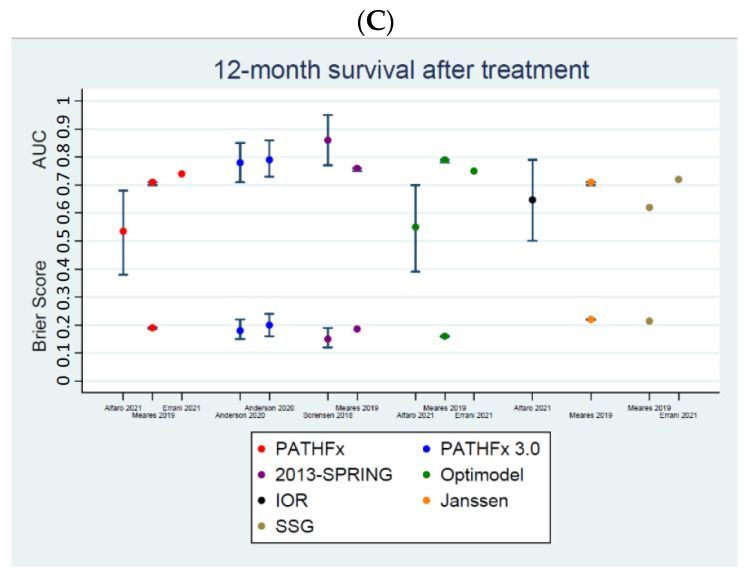
Figure 2.
Performance status graphs, AUCs (area under the curve) and Brier scores. (A). Comparing metastatic bone disease predicting survival models for 3 months of survival across externally validated studies. (B). Comparing metastatic bone disease predicting survival models for 6 months of survival across externally validated studies. (C). Comparing metastatic bone disease predicting survival models for 12 months of survival across externally validated studies.


