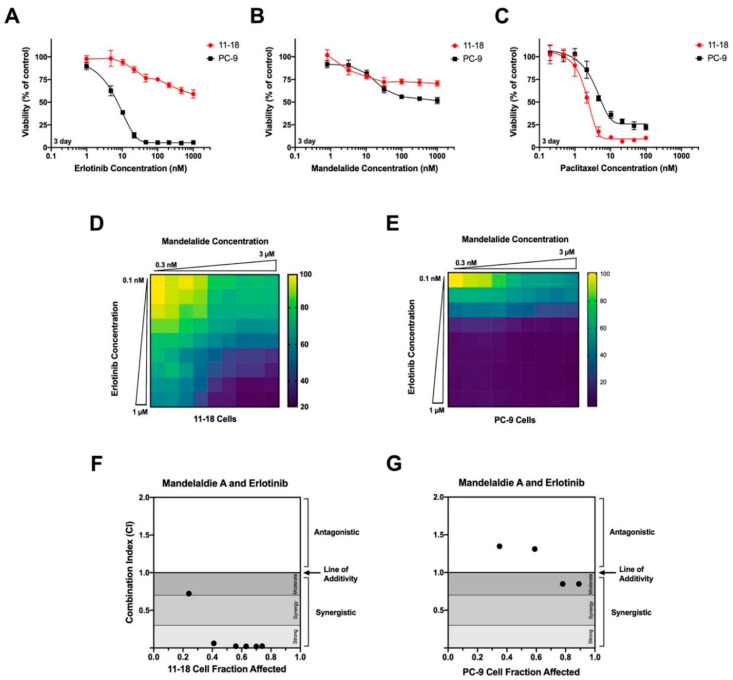
Figure 6.
Analysis of the cytotoxic efficacy of mandelalide A in combination with erlotinib. Concentration-dependent changes in the viability of human 11-18 and PC-9 NSCLC cells in response to (A) erlotinib, (B) mandelalide A or (C) paclitaxel alone. Cells were exposed to increasing concentrations of each compound, as indicated, and cell viability was determined at 72 h with the viability of vehicle-treated (0.1% DMSO) cells defined as 100% viability. Data points represent mean viability ± S.E. (n = 3 wells per treatment) and curves represent the fit of data points by nonlinear regression analysis to a logistic equation. Cell viability curves are representative of a comparison that was repeated three times. (D,E) Heat map representing relative cell viability (%) in response to mandelalide A and erlotinib in combination. Heat maps represent representative experiments for (D) 11-18 and (E) PC-9 cells for a combination matrix experiment that was repeated three times with similar results. Combination index plots for (F) 11-18 and (G) PC-9 NSCLC cells using the Chou-Talay Combination Index method. Points below 1 indicate synergy.

