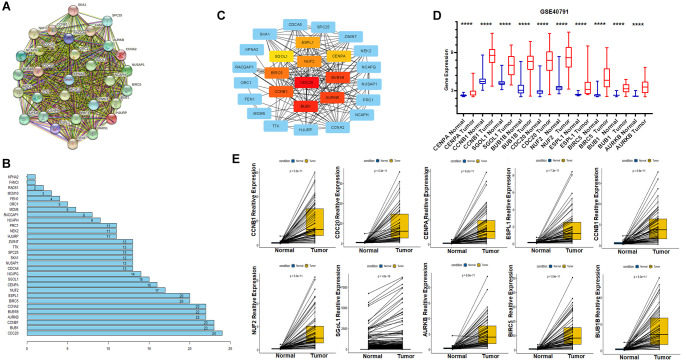
Figure 4.
Identification of hub genes using Protein-Protein Interaction Network and Cytoscape; GEO dataset validates expression of key genes. (A) Protein- Protein Interaction Network of Key Genes. (B) Number of edges per key gene. (C) The CytoHubba plug-in identifies hub genes and marks them with different colours, red for high correlation, orange for moderate correlation and yellow for low correlation. (D) External validation of the GSE40791 dataset for differential expression of hub genes in tumor and normal tissues. (E) Paired expression analysis of hub genes from TCGA.

