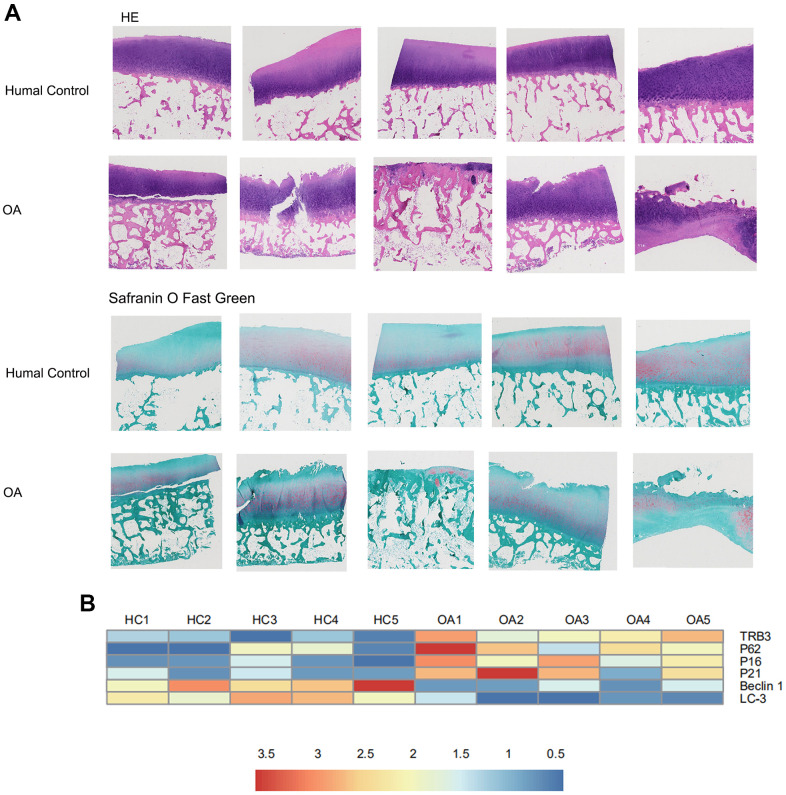
Figure 1.
The results of histology for cartilage degradation in the control and osteoarthritis groups. (A) Representative photomicrographs HE staining and Safranin-O/Light Green Red staining of joint pathological sections of normal joints and OA model, (B) Heatmap analyses of the key molecules regulated in OA patients and healthy controls based on transcriptome analysis. Green, low expression levels; red, high expression levels.

