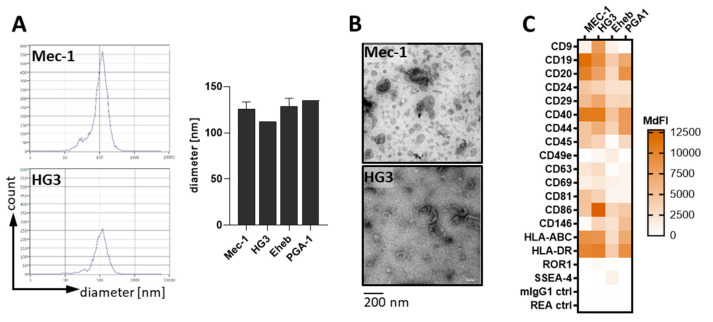
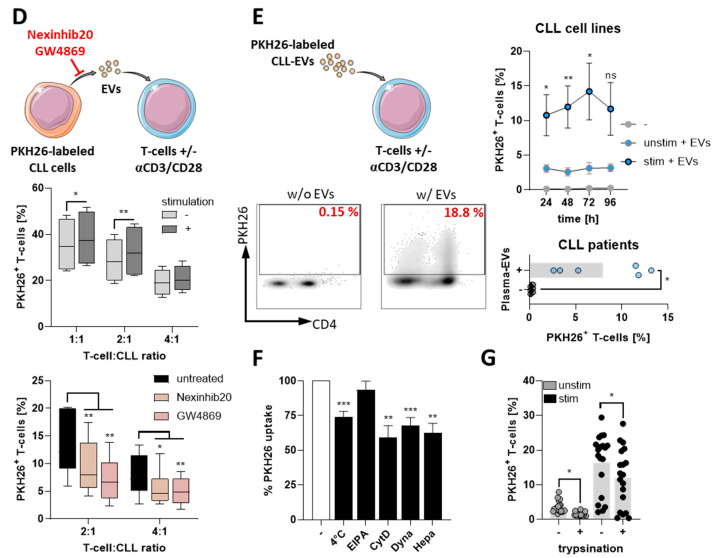
Figure 1.
CLL-cells secrete EVs that attach to and enter T-cells. (A) Isolated EVs from the CLL cell lines (Mec-1 n = 4, HG3 n = 1, Eheb n = 4, and PGA1 n = 1) were analyzed for their diameter by nanoparticle tracking (ZetaView®) as representatively shown on the left and quantified on the right. (B) CLL-EVs were visualized using electron microscopy. (C) Membrane-bound markers on CLL-EVs were analyzed using a flow-cytometry-based multiplex assay (n = 3–5). Values are shown as the median fluorescence intensity (MdFI). (D) Top panel: healthy donor (HD)-derived T-cells were cultured together with PKH26-labeled CLL cell lines at indicated cell rations for 24 h in the absence(-)/presence(+) of activating anti-CD2/CD3/CD28-coated beads and analyzed for the PKH26 signal by means of flow cytometry (n = 4). Bottom panel: anti-CD2/CD3/CD28-stimulated HD-derived T-cells were cultured together with PKH26-labeled CLL cell lines at indicated cell rations for 24 h in the absence/presence of inhibitors for vesicle secretion (Nexinhib20, GW4869) and analyzed for the PKH26 signal by means of flow cytometry (n = 6). (E) HD-derived T-cells were cultured with isolated, PKH26-labeled CLL-EVs from cell lines (top right, n = 4) for indicated times or patient plasma (bottom right, n = 6) for 24 h and analyzed for the frequency of PKH26+ T-cells by flow cytometry (representative density plot on the left). (F) CLL-EV uptake by T-cells was further analyzed after 6 h under different conditions as indicated and depicted in relation to untreated (-, set as 100%, n = 11). (G) HD-derived T-cells that were incubated with PKH26-labeled CLL-EVs for 24 h were trypsinized before the analysis to erase surface-bound EVs and compared to untrypsinized controls (n = 19). Error bars show the standard error mean. * p < 0.05, ** p < 0.01, *** p < 0.001, ns not significant.


