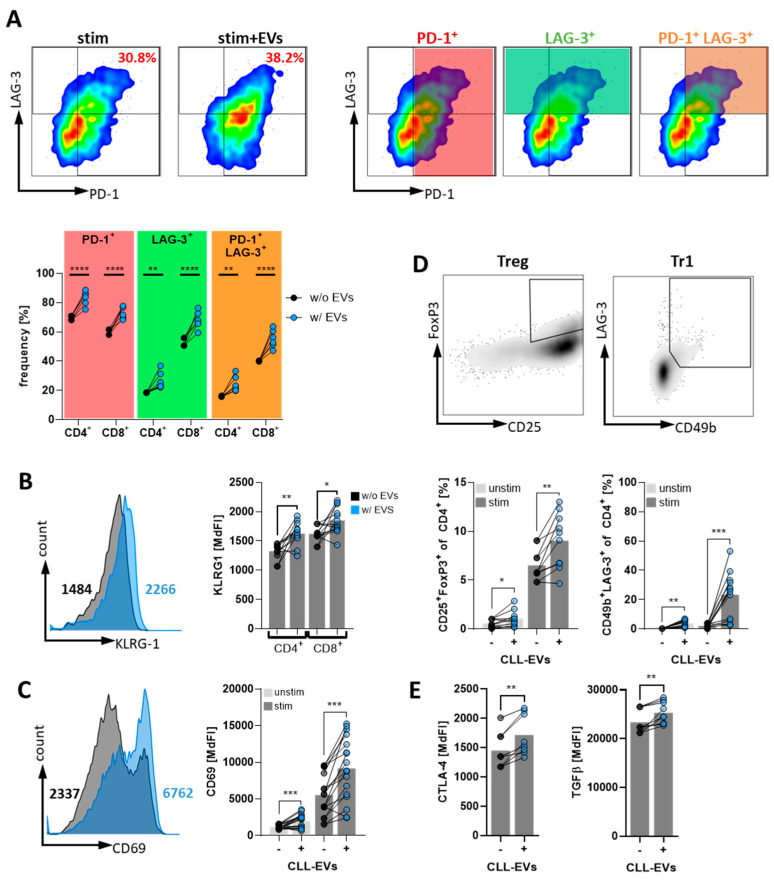
Figure 4.
CLL-EVs promote T-cell exhaustion and regulatory T-cell formation. (A–C) The exhaustion markers PD-1 and LAG-3 (A, n = 6), KLRG1 (B, n = 12), and CD69 (C, n = 17) were analyzed on the surface of activated CD4+ and CD8+ T-cells after 72 h of culture in the absence/presence of CLL-EVs as representatively shown in the flow cytometry plots on the top (gating strategy depicted with colored gates matching to the populations in the graph) and quantified in the graphs at the bottom. (D) Frequencies of regulatory T-cell subsets were analyzed within isolated CD4+ T-cells cultured for 72 h in the absence/presence of CLL-EVs based on the expression of CD25/FoxP3 (Tregs, n = 10) and CD49b/LAG3 (Tr1, n = 12) as representatively shown in the density plots and summarized in the graphs. (E) Surface levels of CTLA-4 and intracellular levels of TGFβ were flow cytometrically measured in isolated, activatedCD4+ T-cells cultured in the absence/presence of CLL-EVs for 72 h (n = 8). * p < 0.05, ** p < 0.01, *** p < 0.001, **** p < 0.0001. MdFI: median fluorescence intensity.

