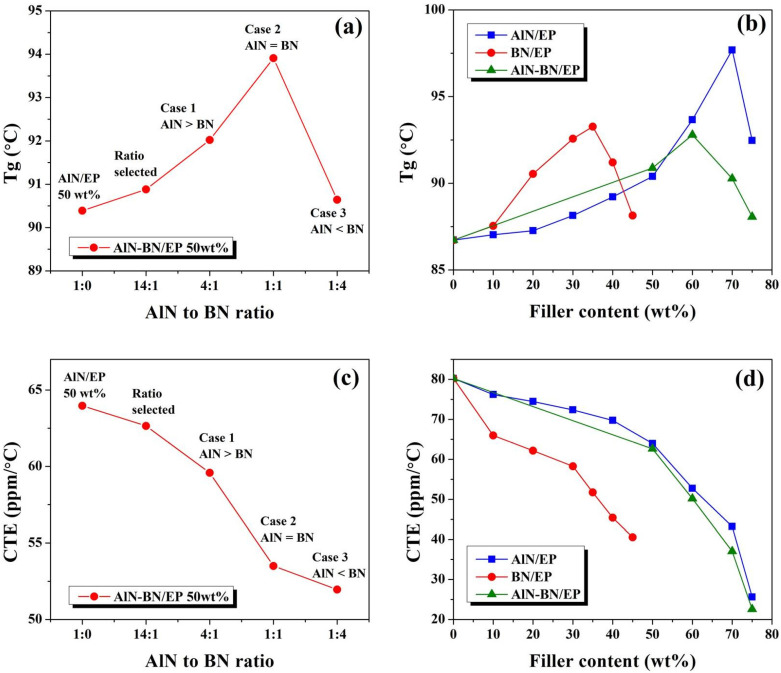
Figure 7.
Tg graphs for (a) AlN–BN/EP composites at a fixed total filler content of 50 wt% with different ratios of AlN to BN particles and for (b) different EP composites versus filler loading. CTE below Tg graphs for (c) AlN–BN/EP composites at a fixed total filler content of 50 wt% with different ratios of AlN to BN particles and for (d) EP composites versus filler loading.

