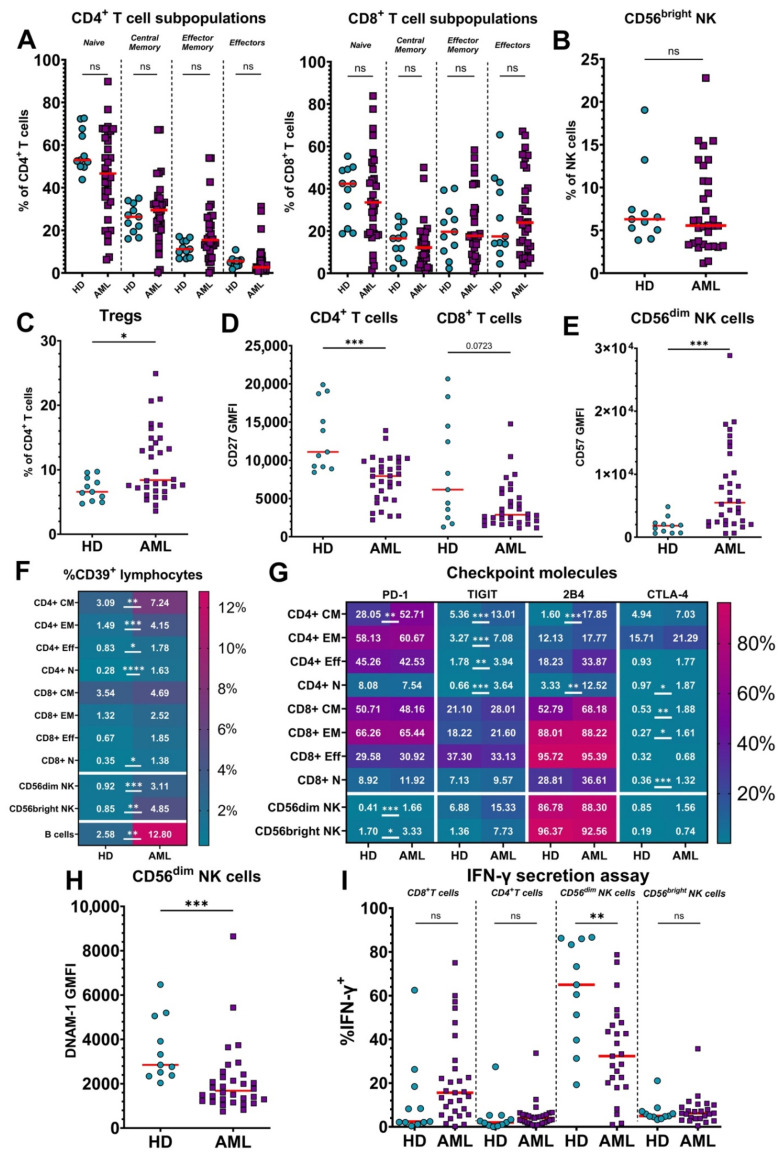
Figure 1.
Comparison of the characteristics of lymphocytes from untreated acute myeloid leukemia (AML) patients and healthy donors. Lymphocytes of 32 AML patients and 11 healthy donors (HDs) were examined to identify differences in their phenotype and function. (A) Percentages of subsets of CD4+ (left) and CD8+ (right) T cells were measured by flow cytometry by staining CD45RA and CD62L; medians are marked by red bars. HDs are represented by blue circles, AML patients by purple squares. (B) Percentage of immature CD56bright NK cells among total NK cells from HDs and untreated AML patients. (C) Percentage of CD25highCD127low Tregs among CD4+ T cells from HDs and untreated AML patients. (D) Geometric Mean Fluorescence Intensity (GMFI) of CD27 expression on CD4+ and CD8+ T cells from HDs and untreated AML patients. (E) GMFI of CD57 expression on CD56dim NK cells from HDs and untreated AML patients. (F) Proportion of CD39 expressing lymphocytes from HDs and untreated AML patients. The data are shown as a heatmap of median percentage expression of CD39 with scale at the right. Rows represent different lymphocytic populations: CM—central memory, EM—effector memory, Eff—effector, N—naïve. (G) Median percentages of HDs and untreated AML patient lymphocyte subsets expressing immune checkpoint molecules PD-1, TIGIT, 2B4, and CTLA-4, as described for panel F. (H) GMFI of DNAM-1 expression on mature CD56dim NK cells from untreated AML patients. (I) Comparison of the percentages of major T and NK cell subsets secreting IFN-γ from HDs and AML patients measured after 2.5 h of in vitro stimulation. The reduced number of AML patients in both assays is due to inadequate numbers of lymphocytes in some untreated blood samples. Mann–Whitney nonparametric U test was used for statistical analysis. ns—p > 0.05; *—p < 0.05; **—p < 0.01; ***—p < 0.001; ****—p < 0.0001. Actual p-value is specified in cases when it is close to 0.05.

