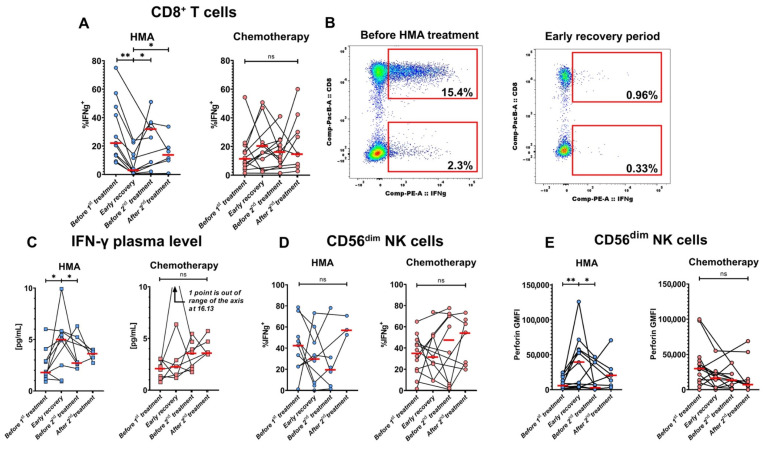
Figure 4.
HMA/venetoclax treatment inhibits IFN-γ production by T cells and enhances perforin accumulation in cytotoxic lymphocytes. AML patients were divided into treatment groups: (1) HMA/venetoclax (“HMA”, blue circles, n = 12 for T cell assay, n = 10 for NK cell assay) and (2) IC (“Chemotherapy”, pink circles, n = 14 for T cell assay, n = 13 for NK cell assay). All patients with >1 sample collected were included in the plots. (A) Dynamics of % IFN-γ-secreting CD8+ T cells during HMA/venetoclax (left) and IC (right) treatments. (B) Representative flow cytometry dot plots of changes in frequencies of IFN-γ-secreting CD8+ T cells before treatment (left) and after the induction of HMA/venetoclax therapy (right) from patient #28 (see Supplementary Table S1). The clusters of cells displayed at the bottom of each panel are CD4+, and top clusters are CD8+. Numbers are percentages of total CD4+ and CD8+ T cells. (C) Dynamics of IFN-γ level in plasma from AML patients treated with HMA/venetoclax (left) and IC (right). (D) % IFN-γ-secreting CD56dim NK cells during the courses of HMA/venetoclax (left) and IC (right). (E) Change in CD56dim NK cell perforin GMFI under HMA/venetoclax treatment (left) and IC (right). Red bars represent medians. Wilcoxon signed-rank test was used for statistical analysis. ns—p > 0.05; *—p < 0.05; **—p < 0.01.

