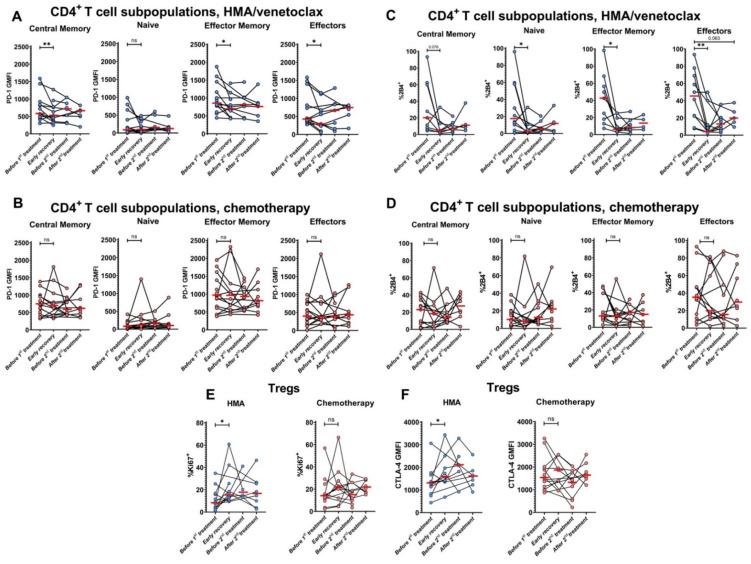
Figure 5.
Initial course of HMA/venetoclax treatment reduces expression of checkpoint molecules PD-1 and 2B4 and enhances Treg proliferation and CTLA-4 expression. GMFI of PD-1 expression on CD4+ T cell subpopulations during treatment with HMA/venetoclax (A) or IC (B). (C,D) The changes in % CD4+ T cell subpopulations expressing 2B4 when treated with HMA/venetoclax (C) or IC (D). (E) Dynamics of the proportions of Ki67+ Tregs during the treatments. (F) GMFI of CTLA-4 expression on Tregs during the treatments. Red bars represent medians. Data are from patients with >1 sample collected. Blue circles are HMA/venetoclax, and pink circles are chemotherapy. Wilcoxon signed-rank test was used for statistical analysis. ns—p > 0.05; *—p < 0.05; **—p < 0.01. Actual p-value is specified in cases when it is close to 0.05.

