
FIGURE 2.
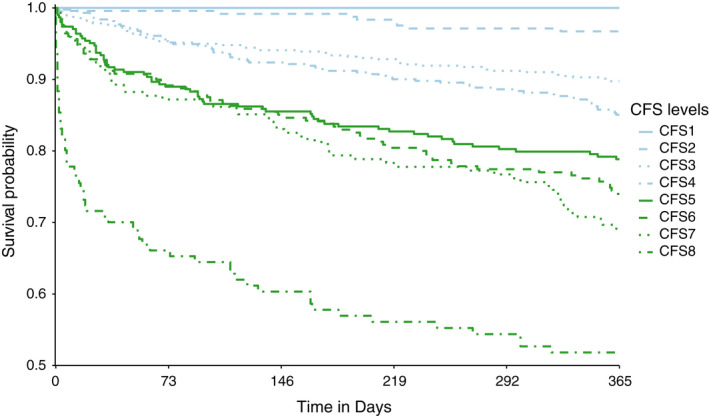
Survival curves for the populations of each CFS level, except level 9 (“terminally ill”), is shown. CFS levels 1 and 2 were included here, in contrast to how these values were excluded in the logistic regression model (Table 2), as this graph is a descriptive representation. The graph was cropped to 0.5 on the y‐axis