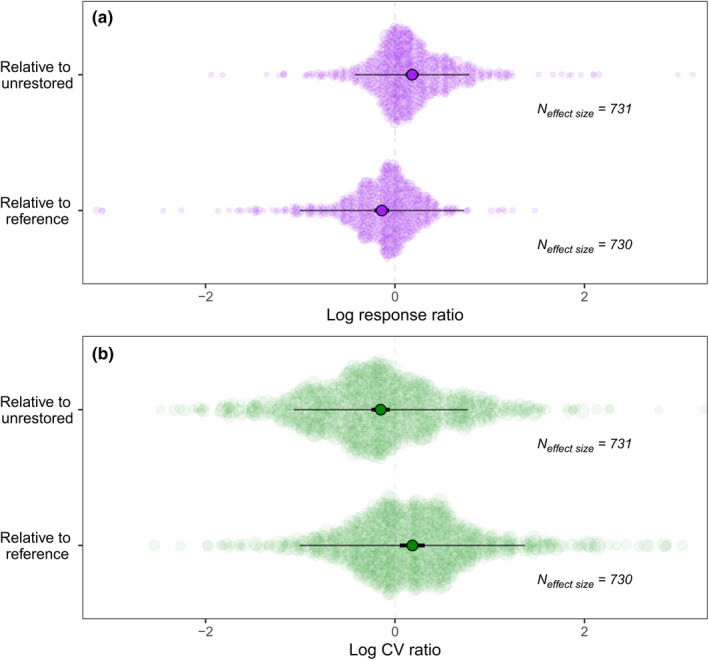
FIGURE 2.

Meta‐analytic model results comparing the (a) mean (LnRR) and (b) variability (LnCVR) of biodiversity in restored sites with either unrestored or reference sites (central points represent model estimated means, thick bars represent 95% confidence intervals, and thin bars 95% prediction intervals). Each background point is an effect size, and its size is scaled by the precision of that estimate (1/SE). Note that a small number of outliers have not been shown here (those <‐3 or >3) but are visible on Figure 5
