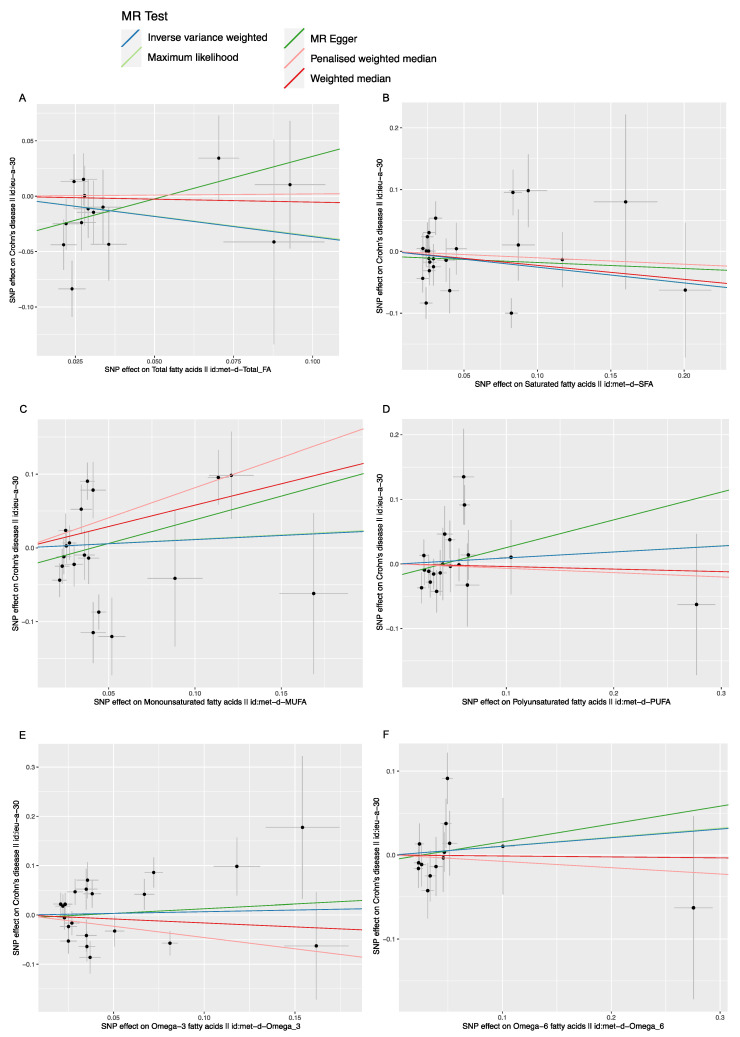
Figure 3.
The scatter plot of fatty acids (FAs) and Crohn’s disease (CD). X axis, the single nucleotide polymorphism (SNP) effect and SEs (standard errors) on each of the selected SNPs from FA Genome-wide summary association study (GWA) datasets. Y axis, the SNP effect and SEs on CD from CD Genome-wide summary association study (GWA) datasets. (A) Analysis of Total FA and CD; (B) Analysis of saturated FA and CD; (C) Analysis of monounsaturated FA and CD; (D) Analysis of polyunsaturated FA and CD; (E) Analysis of Omega-3 FA and CD; (F) Analysis of Omega-6 FA and CD.

