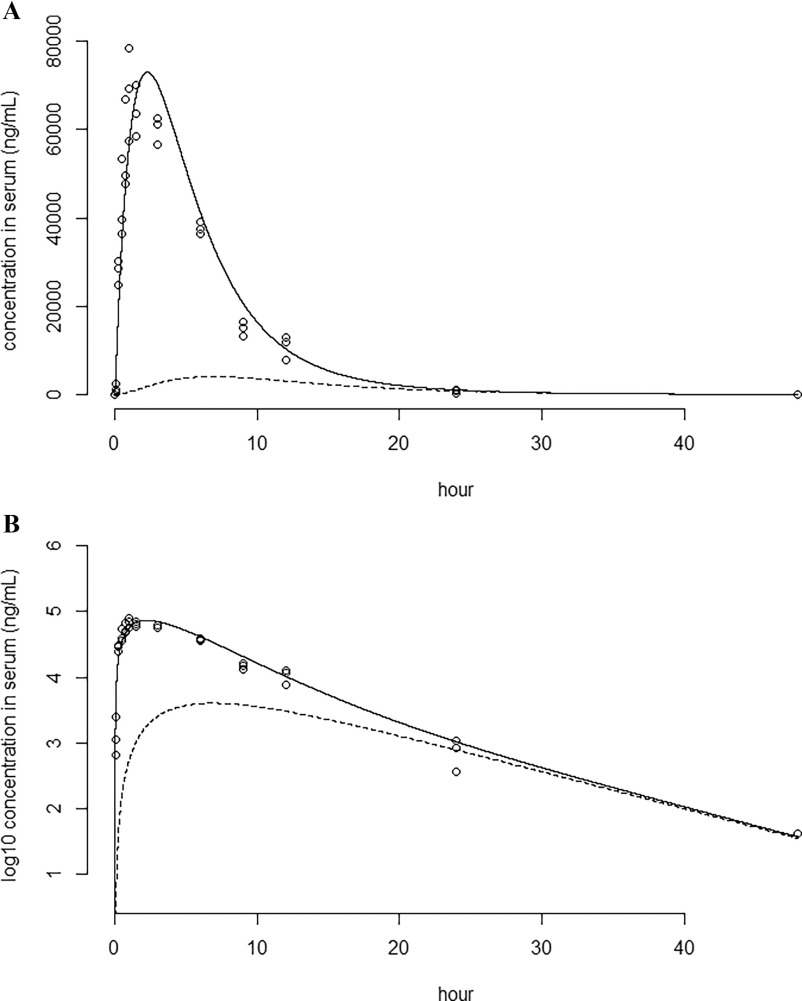
Figure 3.
Perfluorobutane sulfonic acid (PFBS) serum concentration plotted against time (h) after an oral single dose of 20 mg/kg in male rats. Note: The solid line is the modeled concentration in the serum (nanograms per milliliter). The dashed line indicates the concentration in the peripheral compartment (nanograms per milliliter). Circles are the measured concentrations of the individual animals () retrieved from Huang et al.102 Figures are plotted on a linear (A) and (B) scale.

