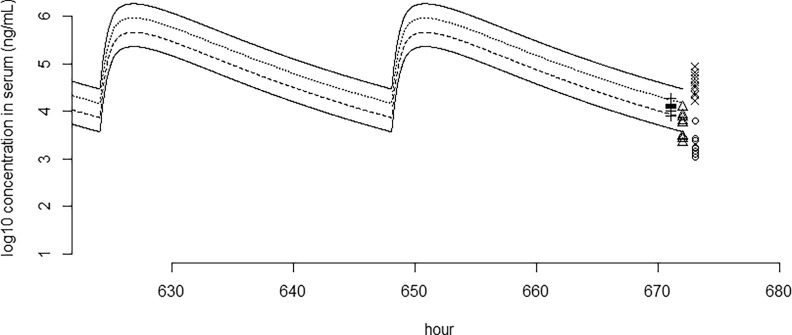
Figure 4.
Modeled perfluorobutane sulfonic acid (PFBS) serum concentrations over time upon daily dosing together with 28-d serum concentrations (symbols) in male rats () as reported in NTP,99 plotted on -scale. Only the last of the experiment are shown. Note: Lowest solid line and circles ; dashed line and triangles ; dotted line and plusses ; upper solid line and crosses . To distinguish measured points, they have been shifted slightly.

