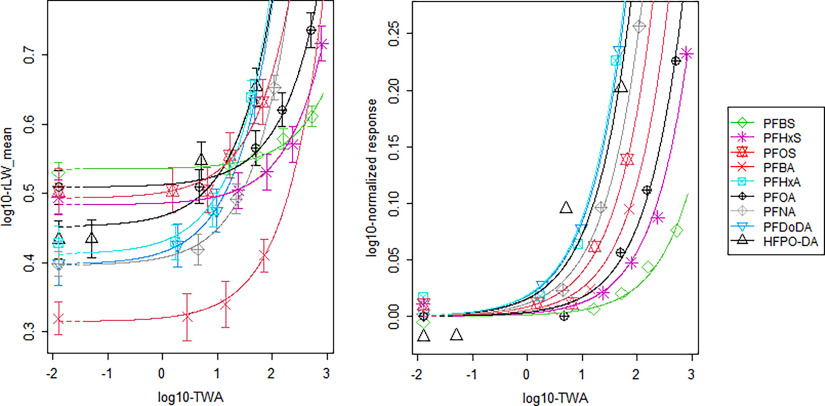
Figure 5.
Dose–response curves for mean relative liver weight increase (g/100 g body weight) plotted against the internal dose (expressed as TWA in milligrams per milliliter) on a -scale for nine PFAS, obtained by fitting the exponential model with a study-specific (modeled) background response (left plot) and normalized to the background response (right plot). Note: Figures represent geometric mean response for each dose group, as derived from the summary data (Table S1). For clarity, the whiskers indicating the 95% confidence intervals of the means are not plotted in the right plot. HFPO-DA, hexafluoropropylene oxide-dimer acid; PFAS, per- and polyfluoroalkyl substances; PFBA, perfluorobutanoic acid; PFBS, perfluorobutane sulfonic acid; PFDoDA, perfluorododecanoic acid; PFHxA, perfluorohexanoic acid; PFHxS, perfluorohexane sulfonic acid; PFNA, perfluorononanoic acid; PFOA, perfluorooctanoic acid; PFOS, perfluorooctane sulfonic acid; rLW, relative liver weight; TWA, time-weighted average.

