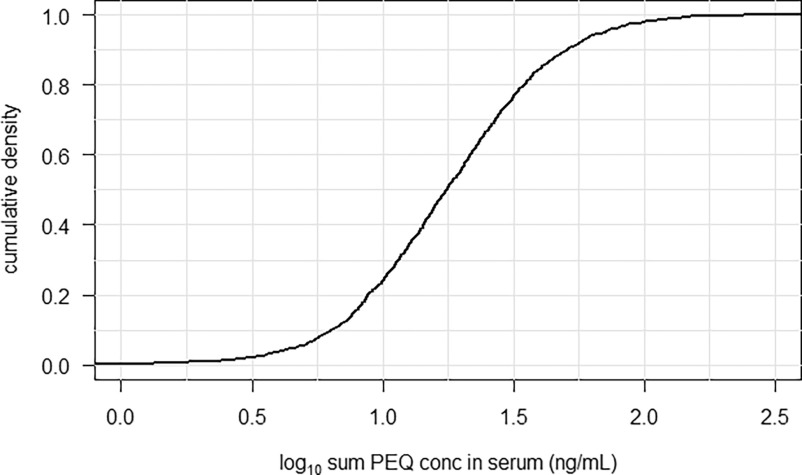
Figure 8.
Cumulative density plot of the sum PFOA Equivalent (PEQ) concentration in serum (ng/mL) from the 2017–2018 National Health and Nutrition Examination Survey (NHANES) study population, ages 12 and older ().82 Note: The black line represents the sum PEQ of all PFAS [perfluorohexanoic acid (PFHxA), perfluorooctanoic acid (PFOA), perfluorononanoic acid (PFNA), perfluorohexane sulfonic acid (PFHxS), perfluoroocane sulfonic acid (PFOS), hexafluoropropylene oxide-dimer acid (HFPO-DA)] of which internal relative potency factors were derived.

