
Figure 8.
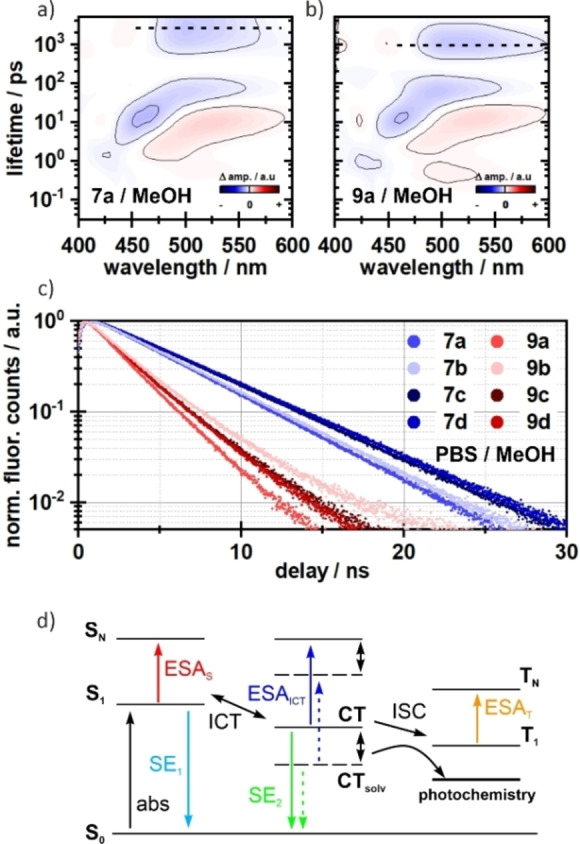
Lifetime density analysis of 7 a (a) and 9 a (b) measured in MeOH. The ES decay is faster in compound 9 a (indicated as dashed lines), whereas the dynamics on the fs‐ to ps‐timescale do not differ. A similar pattern is seen in the TCSPC measurements (c). The fluorescence lifetimes of compounds 9 a–d are roughly 2‐fold faster. The corresponding lifetime components are given in the Supporting Information. d) Schematic representation of possible energy pathways. After excitation, an equilibrium between the locally excited state S1 and the CT state is formed. The CT state is further stabilized by the solvent (indicated by double‐sided arrows), which increases the population of the CT state. Without this stabilization an additional channel for triplet formation becomes relevant, which then competes with the actual photochemistry.