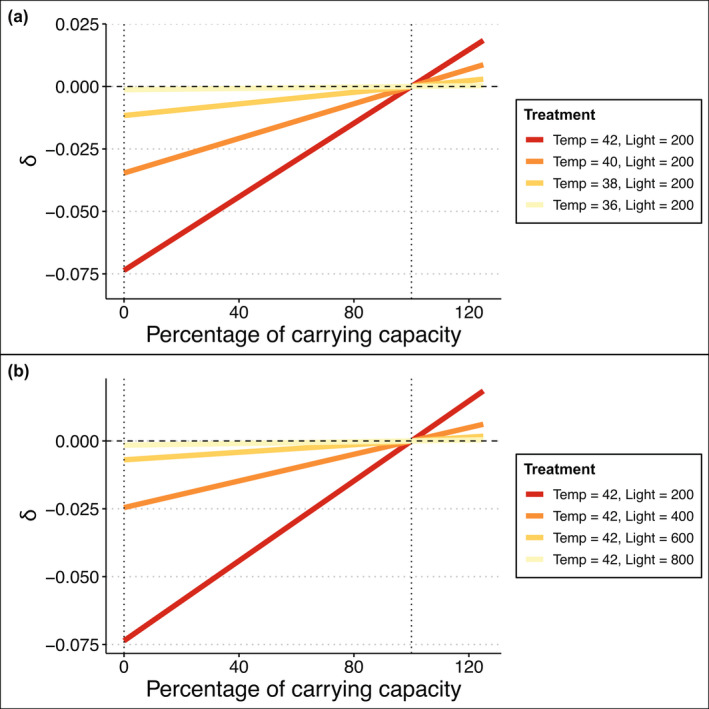
FIGURE 2.

The interaction metric used to assess the physiological sub‐model, , as a function of proportion of carrying capacity achieved through the net production of seagrass under multiple stressor scenarios for (a) fixed light stress (200 μmol) but varied temperature stressor magnitude and (b) fixed temperature stress (42°C) but varied light stressor magnitude. The interaction metric is linearly related to biomass because it is the sum of several other quantities that are linearly related to biomass. Positive values of indicate synergistic interactions, while negative values indicate antagonistic responses of seagrass net production. Dashed line where 0 denotes where interactions are additive. Dotted vertical lines are at 0% and 100% of carrying capacity. The red line represents the highest temperature and light stress combination, whereas the lightest yellow line represents the lowest multiple stressor combination (orange textured boxes in Figure 1)
