
FIGURE 5.
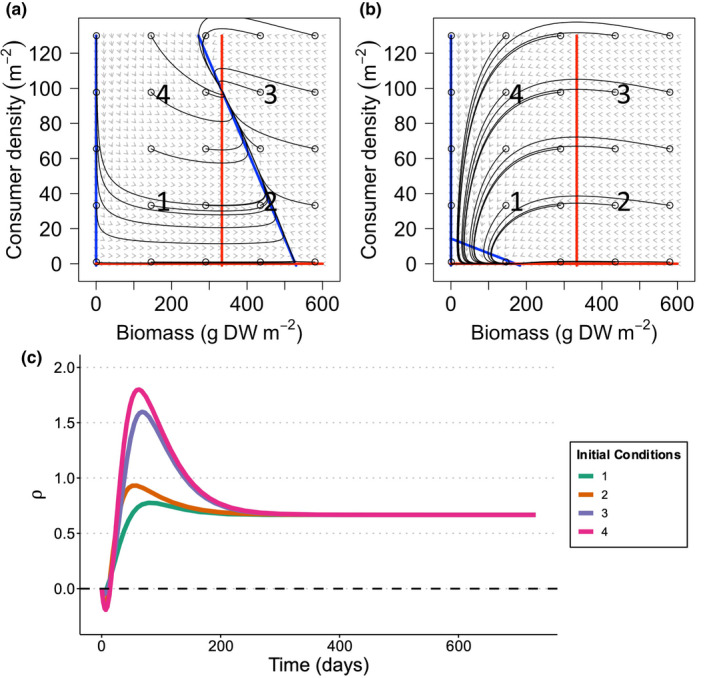
Phase plots under (a) no stress (= optimal, control conditions) and (b) multiple stressors in the consumer‐resource model. Grey arrows indicate the direction of movement and relative magnitude of a particle state change. Blue lines and red lines represent the seagrass‐nullclines and consumer‐nullclines, respectively, and identify states where seagrass and the consumer are at equilibrium. Black lines represent the trajectories of the system, when starting from different initial conditions. Circled numbers (1–4) indicate different initial model conditions and panel c shows behaviour of for each set of initial conditions in panel b